Fig. B.1
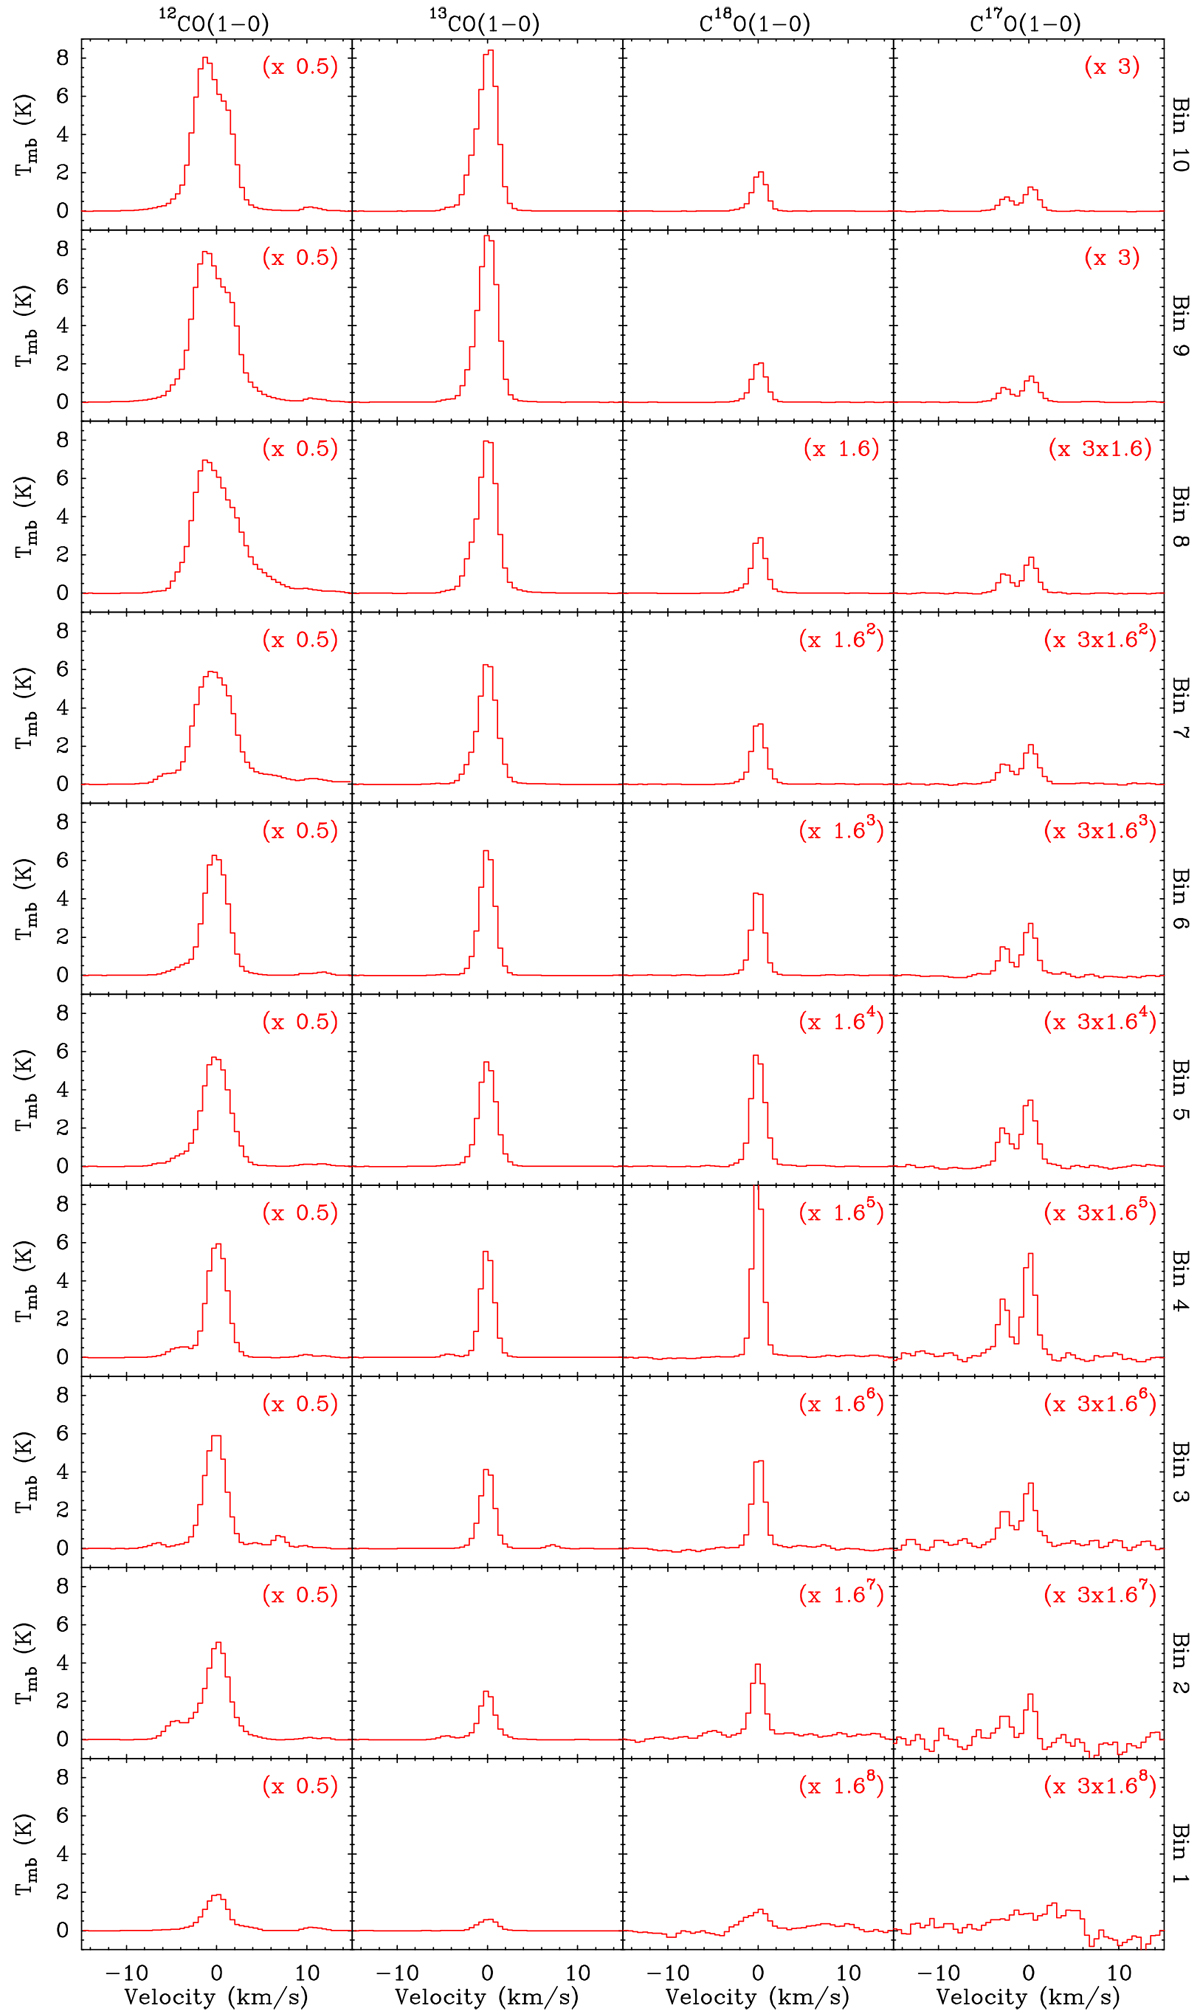
Stacked spectra of the J = 1–0 transition for different CO isotopologs Each spectrum represents the average of the ten spectra taken in the column-density bin indicated in the right label. The mean column density of these bins decreases downward by factors of 1.6, and the spectra have been scaled up by different factors to approximately maintain the same physical size.
Current usage metrics show cumulative count of Article Views (full-text article views including HTML views, PDF and ePub downloads, according to the available data) and Abstracts Views on Vision4Press platform.
Data correspond to usage on the plateform after 2015. The current usage metrics is available 48-96 hours after online publication and is updated daily on week days.
Initial download of the metrics may take a while.