Fig. 10
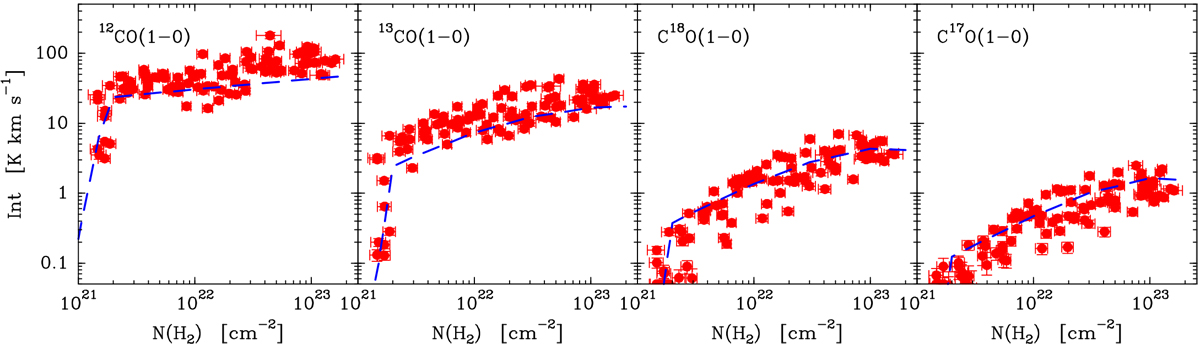
Comparison between observations and model results for the family of CO isotopologs. The red symbols represent the observed intensities of the J = 1–0 line, previously presented in Fig. 4, and the dashed blue lines represent the model results. The sharp drop at low column densities is caused by the photodissociation edge in the abundance profile.
Current usage metrics show cumulative count of Article Views (full-text article views including HTML views, PDF and ePub downloads, according to the available data) and Abstracts Views on Vision4Press platform.
Data correspond to usage on the plateform after 2015. The current usage metrics is available 48-96 hours after online publication and is updated daily on week days.
Initial download of the metrics may take a while.