Fig. 8.
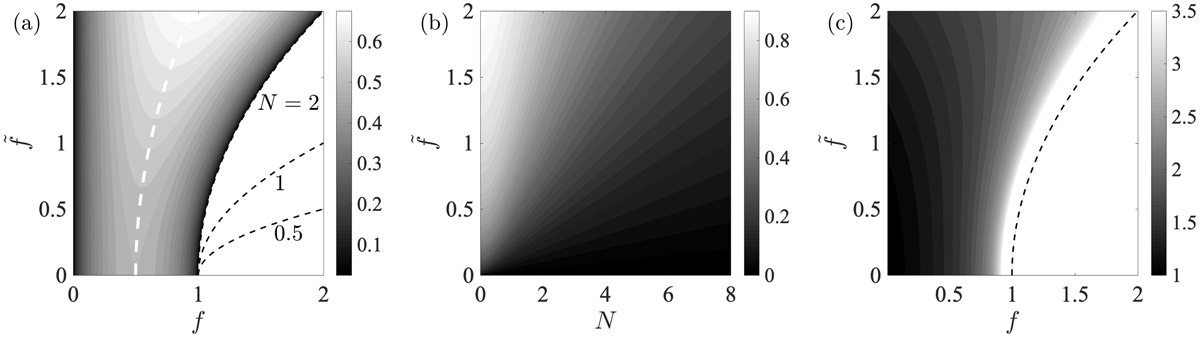
(a) Contours of the maximum growth rate σ0 from Eq. (59) in the parameter space ![]() for N = 2. Black dashed lines represent the upper limit of the instability
for N = 2. Black dashed lines represent the upper limit of the instability ![]() from Eq. (61) for different N, and the white dashed line represents fmax from (64) where the maximum growth rate is attained. (b) Contours of σ0 from Eq. (59) in the parameter space
from Eq. (61) for different N, and the white dashed line represents fmax from (64) where the maximum growth rate is attained. (b) Contours of σ0 from Eq. (59) in the parameter space ![]() at f = 1. (c) Contours of the first-order term σ1 in the parameter space
at f = 1. (c) Contours of the first-order term σ1 in the parameter space ![]() for N = 2 and the first branch at m = 1.
for N = 2 and the first branch at m = 1.
Current usage metrics show cumulative count of Article Views (full-text article views including HTML views, PDF and ePub downloads, according to the available data) and Abstracts Views on Vision4Press platform.
Data correspond to usage on the plateform after 2015. The current usage metrics is available 48-96 hours after online publication and is updated daily on week days.
Initial download of the metrics may take a while.