Open Access
Fig. 7.
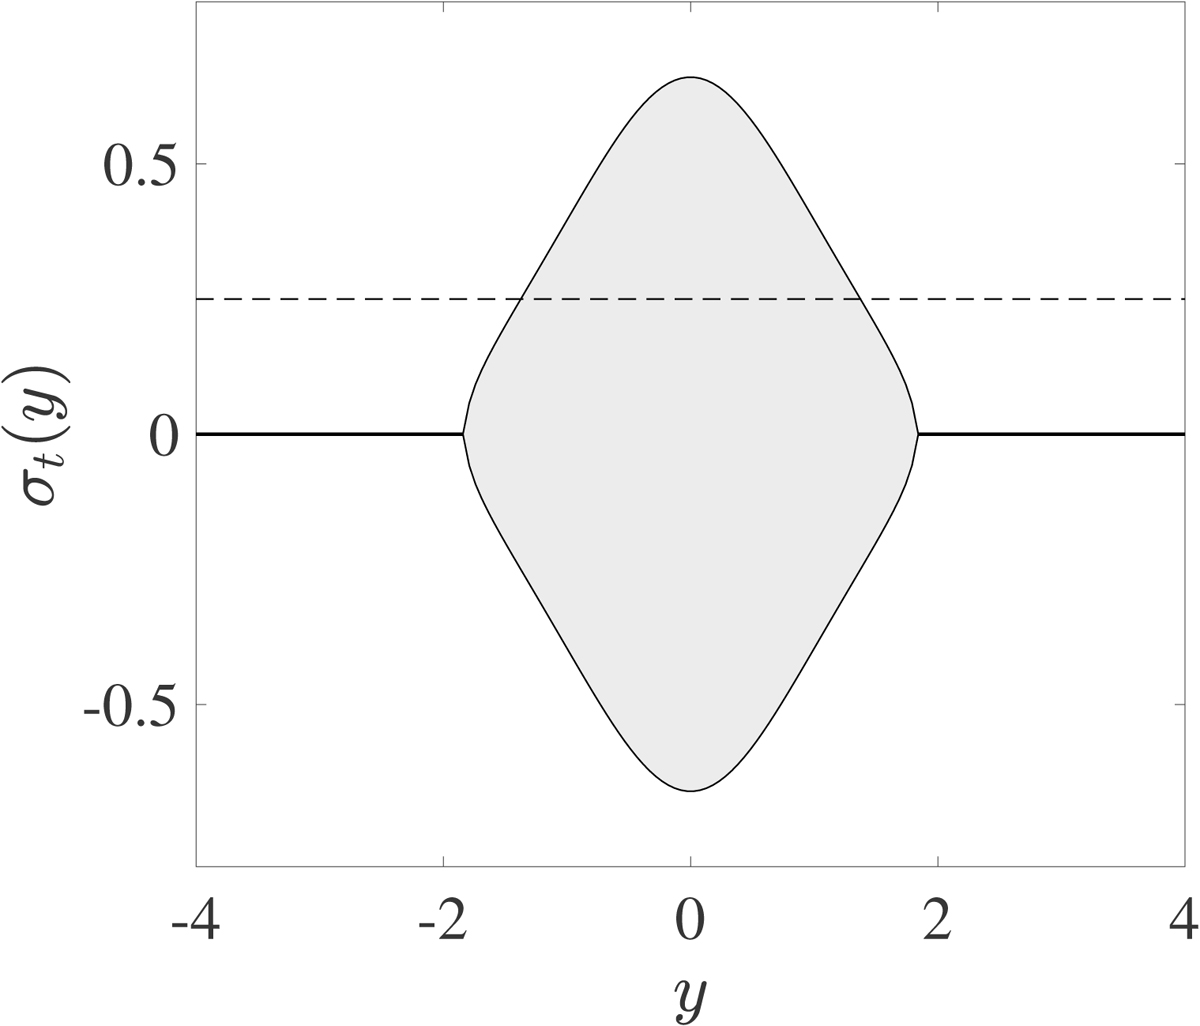
Function σt(y) (solid lines) at N = 1 for ![]() (i.e., Ω = 1.031 and θ = 76°). Gray and white areas denote the regimes where
(i.e., Ω = 1.031 and θ = 76°). Gray and white areas denote the regimes where ![]() is positive and negative, respectively. The dashed line represents an example of the growth rate σ = 0.250.
is positive and negative, respectively. The dashed line represents an example of the growth rate σ = 0.250.
Current usage metrics show cumulative count of Article Views (full-text article views including HTML views, PDF and ePub downloads, according to the available data) and Abstracts Views on Vision4Press platform.
Data correspond to usage on the plateform after 2015. The current usage metrics is available 48-96 hours after online publication and is updated daily on week days.
Initial download of the metrics may take a while.