Fig. 4.
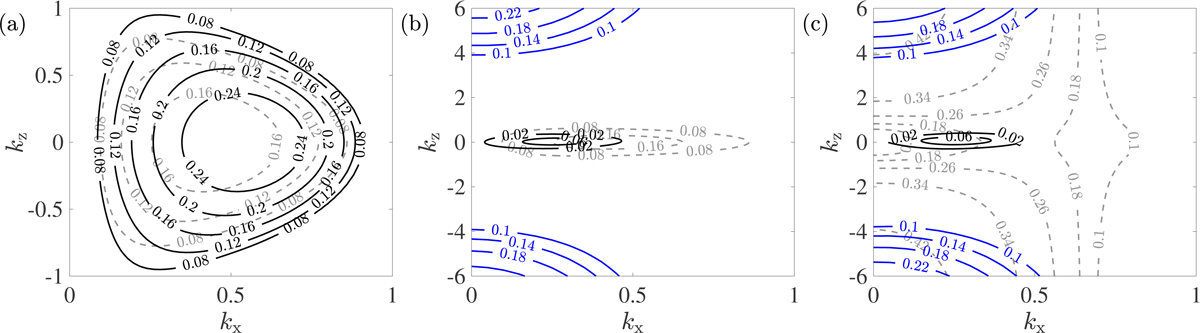
Contours of the maximum growth rate max(σr) in the parameter space of (kx, kz) (solid lines) for Re = ∞ and N = 1 for (a) ![]() , (b)
, (b) ![]() , and (c)
, and (c) ![]() . For (a) and (b), this corresponds to (Ω, θ) = (1, 90° ), and (Ω, θ) = (1.031, 76°) for (c). Black and blue solid lines are contours of the maximum growth rate of the inflectional and inertial instabilities, respectively, and gray dashed lines in the background are contours of the maximum growth rate for the same parameters but in the traditional f-plane approximation where
. For (a) and (b), this corresponds to (Ω, θ) = (1, 90° ), and (Ω, θ) = (1.031, 76°) for (c). Black and blue solid lines are contours of the maximum growth rate of the inflectional and inertial instabilities, respectively, and gray dashed lines in the background are contours of the maximum growth rate for the same parameters but in the traditional f-plane approximation where ![]() .
.
Current usage metrics show cumulative count of Article Views (full-text article views including HTML views, PDF and ePub downloads, according to the available data) and Abstracts Views on Vision4Press platform.
Data correspond to usage on the plateform after 2015. The current usage metrics is available 48-96 hours after online publication and is updated daily on week days.
Initial download of the metrics may take a while.