Fig. 14.
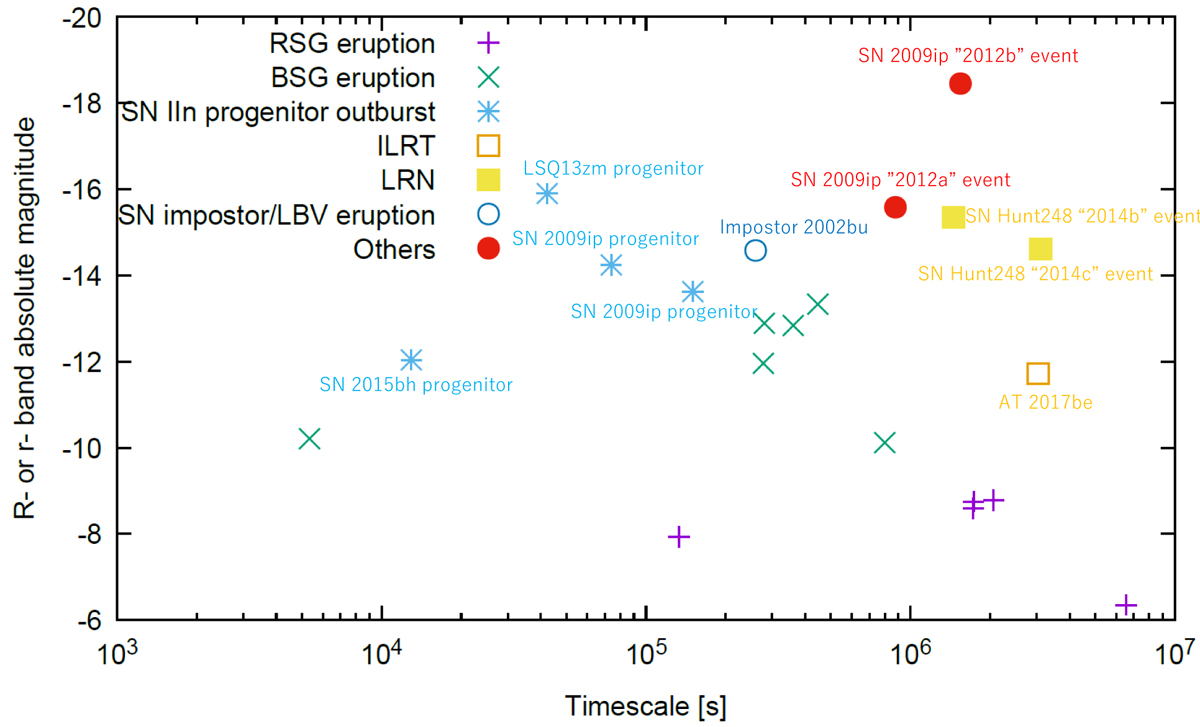
Peak luminosity in R band as a function of the half-decay time of the luminosity for each eruption in our simulation. The bolometric luminosity in our simulation is filtered by Johnson-Cousins R band under the assumption of blackbody radiation. Filter transparency data are taken from the website of Leibniz Institute for Astrophysics Potsdam (AIP). 3064 Jy is adopted as the zero magnitude flux in R band (Bessell et al. 1998). Some observational data of SN progenitor outbursts (SN 2009ip; Pastorello et al. 2013; Fraser et al. 2013b, LSQ13zm Tartaglia et al. 2016, and SN 2015zh; Ofek et al. 2016) and gap transients (intermediate luminosity red transient (ILRT) AT 2017be; Cai et al. 2018, luminous red nova (LRN) SN Hunt248; Mauerhan et al. 2015; Kankare et al. 2015, and SN impostor SN 2002bu; Kato et al. 2004) in R band or r band are also plotted for comparison. Half-decay times of the luminosities for these transients are estimated by linear interpolation of observed magnitudes as a function of time. SN 2009ip shows a lot of peaks (events) in the light curve during 2009–2012. Four representative and well-observed pre-SN outbursts at MJD ∼ 55098, 55826, and the two events (2012a and 2012b) introduced in Sect. 1, are chosen. SN Hunt248, which is thought to be a merger-burst event (Mauerhan et al. 2018) and classified as LRN (e.g., Metzger & Pejcha 2017; Pastorello et al. 2019b), shows triple peaks (outburst events) referred to as 2014a, b, and c (Kankare et al. 2015). The 2014b event had begun before the luminosity of the 2014a event declined by a factor of 2 from the peak. Accordingly, only the 2014b and c events are plotted. It should be noted that objects in this figure are representative and that this figure does not show all of the known pre-SN outbursts or gap transients.
Current usage metrics show cumulative count of Article Views (full-text article views including HTML views, PDF and ePub downloads, according to the available data) and Abstracts Views on Vision4Press platform.
Data correspond to usage on the plateform after 2015. The current usage metrics is available 48-96 hours after online publication and is updated daily on week days.
Initial download of the metrics may take a while.