Fig. 13.
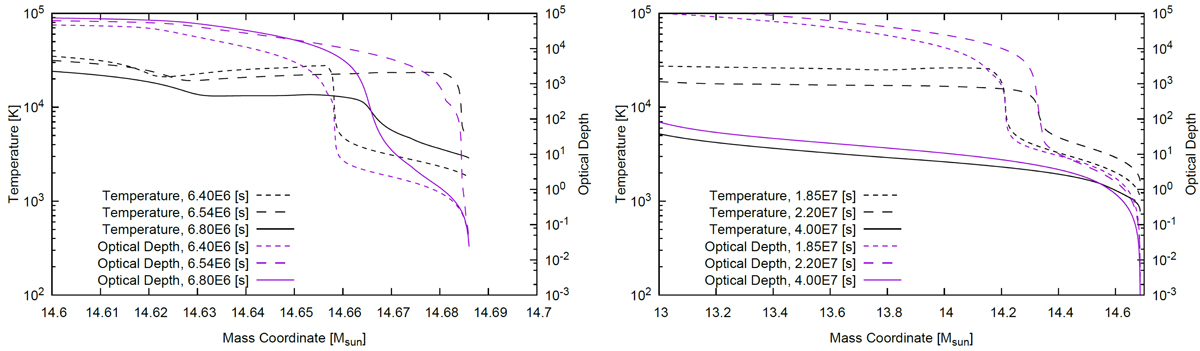
Temperature and optical depth for model RSG1-f during the first eruption (left) and the second eruption (right). Broken lines (6.4E6 in the left panel and 1.85E7 in the right panel) correspond to profiles just before eruptions, long-broken lines correspond to profiles at the time of peaks in the luminosity due to eruptions, and solid lines show the profiles after the luminosity peaks.
Current usage metrics show cumulative count of Article Views (full-text article views including HTML views, PDF and ePub downloads, according to the available data) and Abstracts Views on Vision4Press platform.
Data correspond to usage on the plateform after 2015. The current usage metrics is available 48-96 hours after online publication and is updated daily on week days.
Initial download of the metrics may take a while.