Fig. 12.
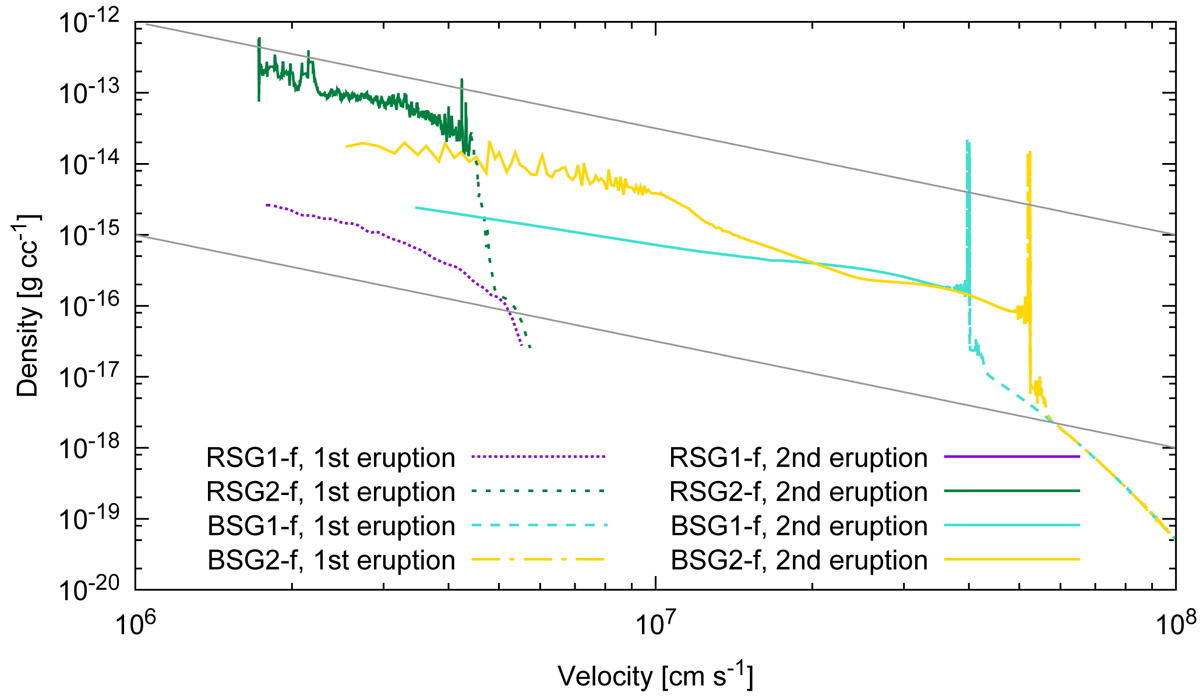
Density profiles of CSM as functions of velocity at the core collapse for the fiducial models. The broken lines (solid lines) correspond to the CSM erupted by the first injection (second injection). The gray line represents the relation ρ ∝ v−1.5, which we adopt as a fiducial slope in the case of eruptive mass loss (Kuriyama & Shigeyama 2020; Tsuna et al. 2020).
Current usage metrics show cumulative count of Article Views (full-text article views including HTML views, PDF and ePub downloads, according to the available data) and Abstracts Views on Vision4Press platform.
Data correspond to usage on the plateform after 2015. The current usage metrics is available 48-96 hours after online publication and is updated daily on week days.
Initial download of the metrics may take a while.