Fig. 1.
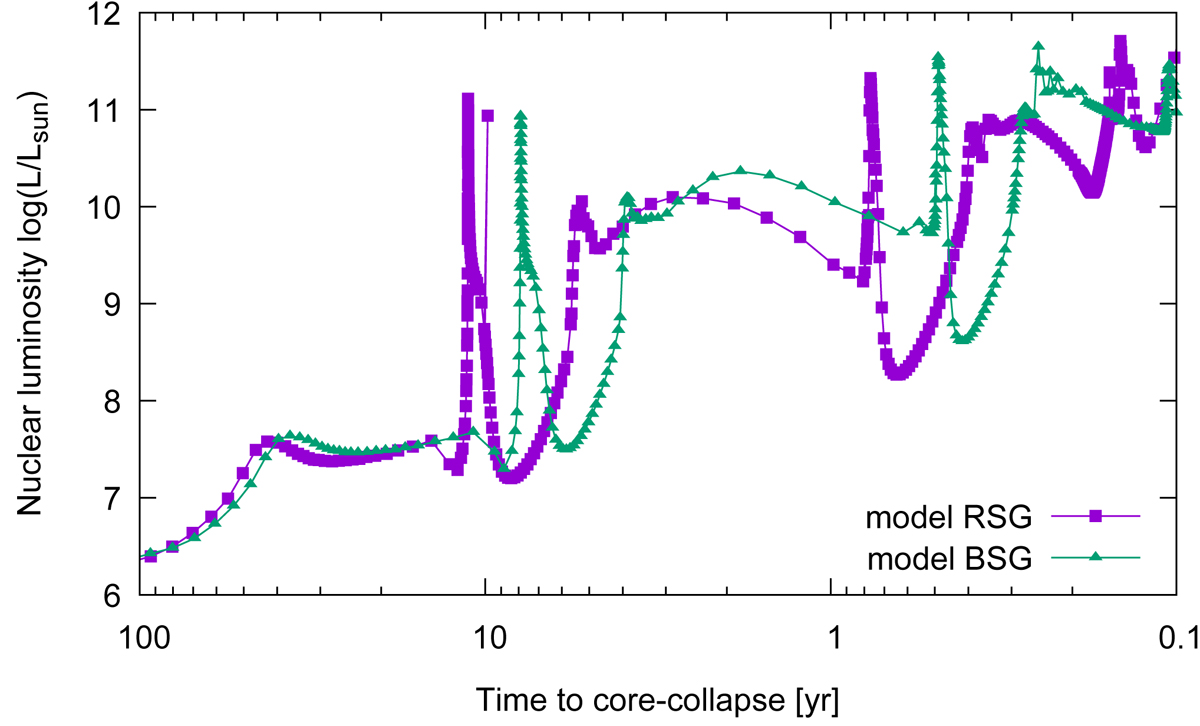
Evolution of the energy generation rate by nuclear burning for each model indicated by labels. The rate becomes higher toward the core collapse. There are some local peaks for each model around ten years, five years, and one year before core collapse. We adopted the peaks at 11.2 years before core collapse (model RSG) and at 7.2 years before core collapse (BSG) as initial models for our calculations. These peaks correspond to the core neon burning phase.
Current usage metrics show cumulative count of Article Views (full-text article views including HTML views, PDF and ePub downloads, according to the available data) and Abstracts Views on Vision4Press platform.
Data correspond to usage on the plateform after 2015. The current usage metrics is available 48-96 hours after online publication and is updated daily on week days.
Initial download of the metrics may take a while.