Free Access
Fig. 7.
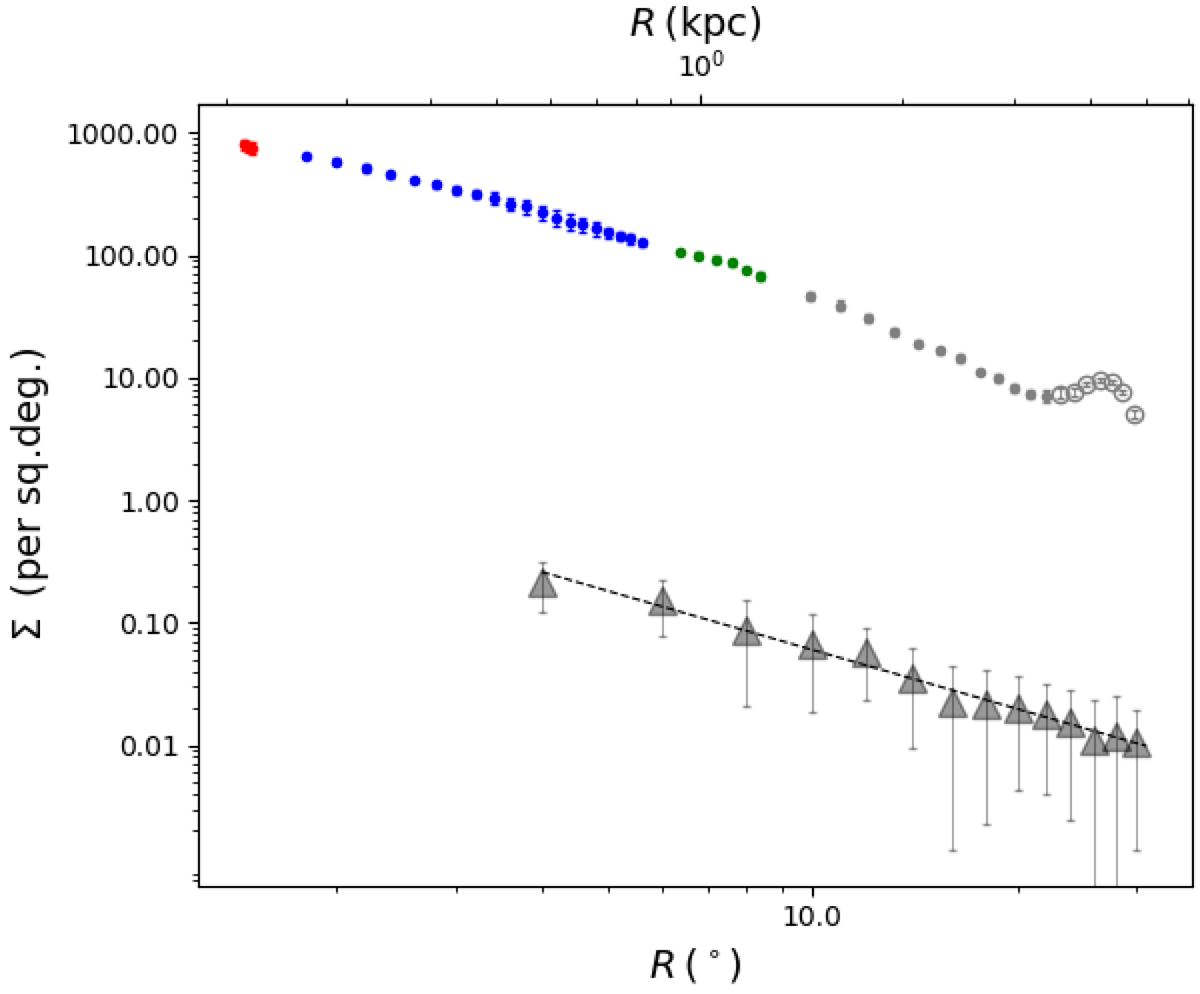
Projected density distribution for RRab (circles) and GCs (triangles) from Harris (2010) and Baumgardt & Hilker (2018). The colours of the RRab distribution are the same as in Fig. 1. The black dashed line shows the best fit with a slope mGCs = −1.59 ± 0.060 for 4.0° < R < 30.0°.
Current usage metrics show cumulative count of Article Views (full-text article views including HTML views, PDF and ePub downloads, according to the available data) and Abstracts Views on Vision4Press platform.
Data correspond to usage on the plateform after 2015. The current usage metrics is available 48-96 hours after online publication and is updated daily on week days.
Initial download of the metrics may take a while.