Fig. 5.
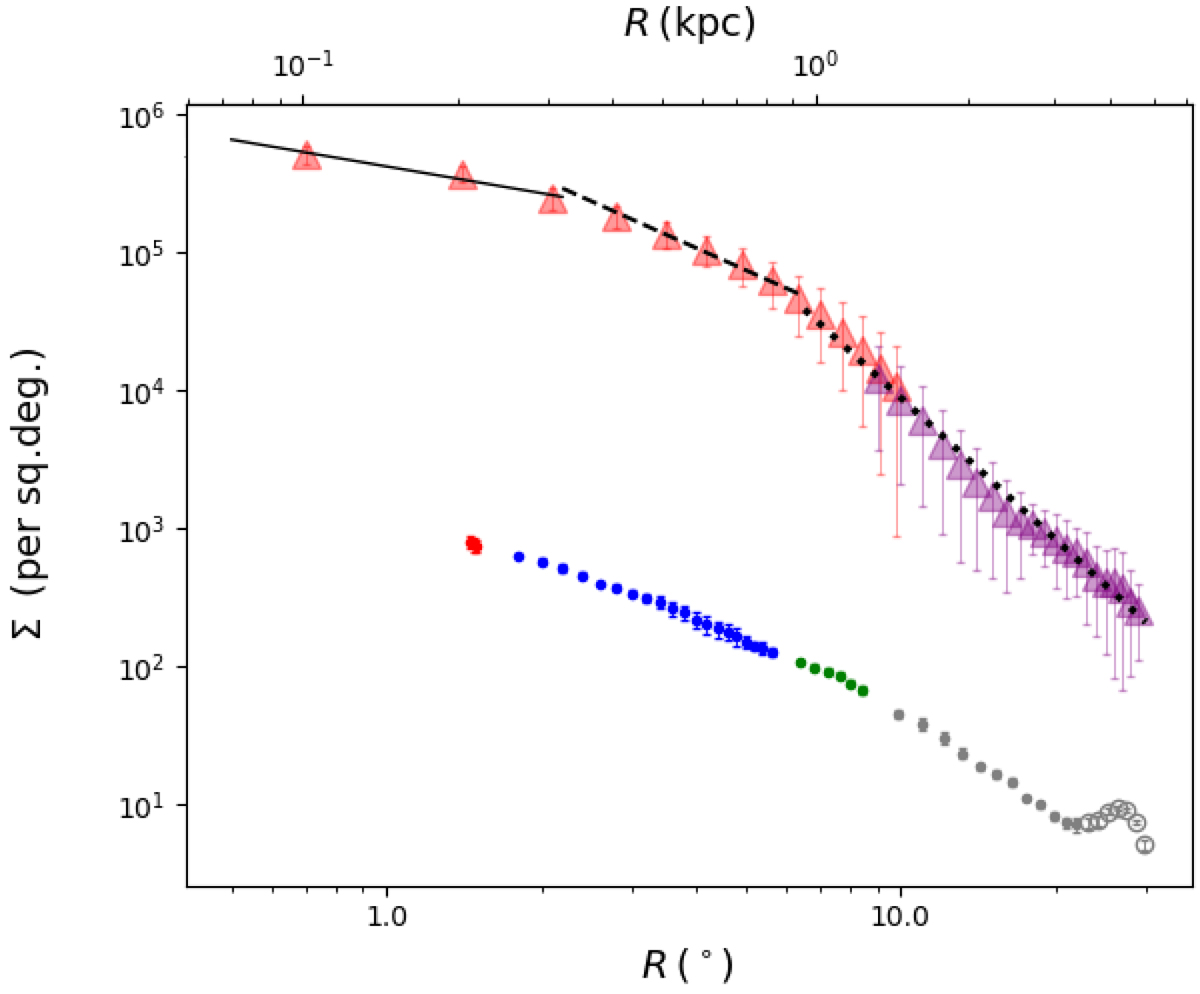
Projected density distribution for the RC population (triangles) and RRab (circles). The colours show the different catalogues used. The red and purple triangles correspond to the VVV and 2MASS surveys, respectively. The colours of the RRab distribution are the same as in Fig. 1. The solid black line shows the power-law fit for the innermost area of R < 2.2° with a slope of mRC[1] = −0.64 ± 0.133. The black semi-dashed line shows the best fit for 2.2° < R < 6.5° with a slope mRC[2] = −1.66 ± 0.100. The best fit for 6.5° < R < 30.0° corresponds to the black dotted line with slope mRC[3] = −3.41 ± 0.075.
Current usage metrics show cumulative count of Article Views (full-text article views including HTML views, PDF and ePub downloads, according to the available data) and Abstracts Views on Vision4Press platform.
Data correspond to usage on the plateform after 2015. The current usage metrics is available 48-96 hours after online publication and is updated daily on week days.
Initial download of the metrics may take a while.