Fig. 1.
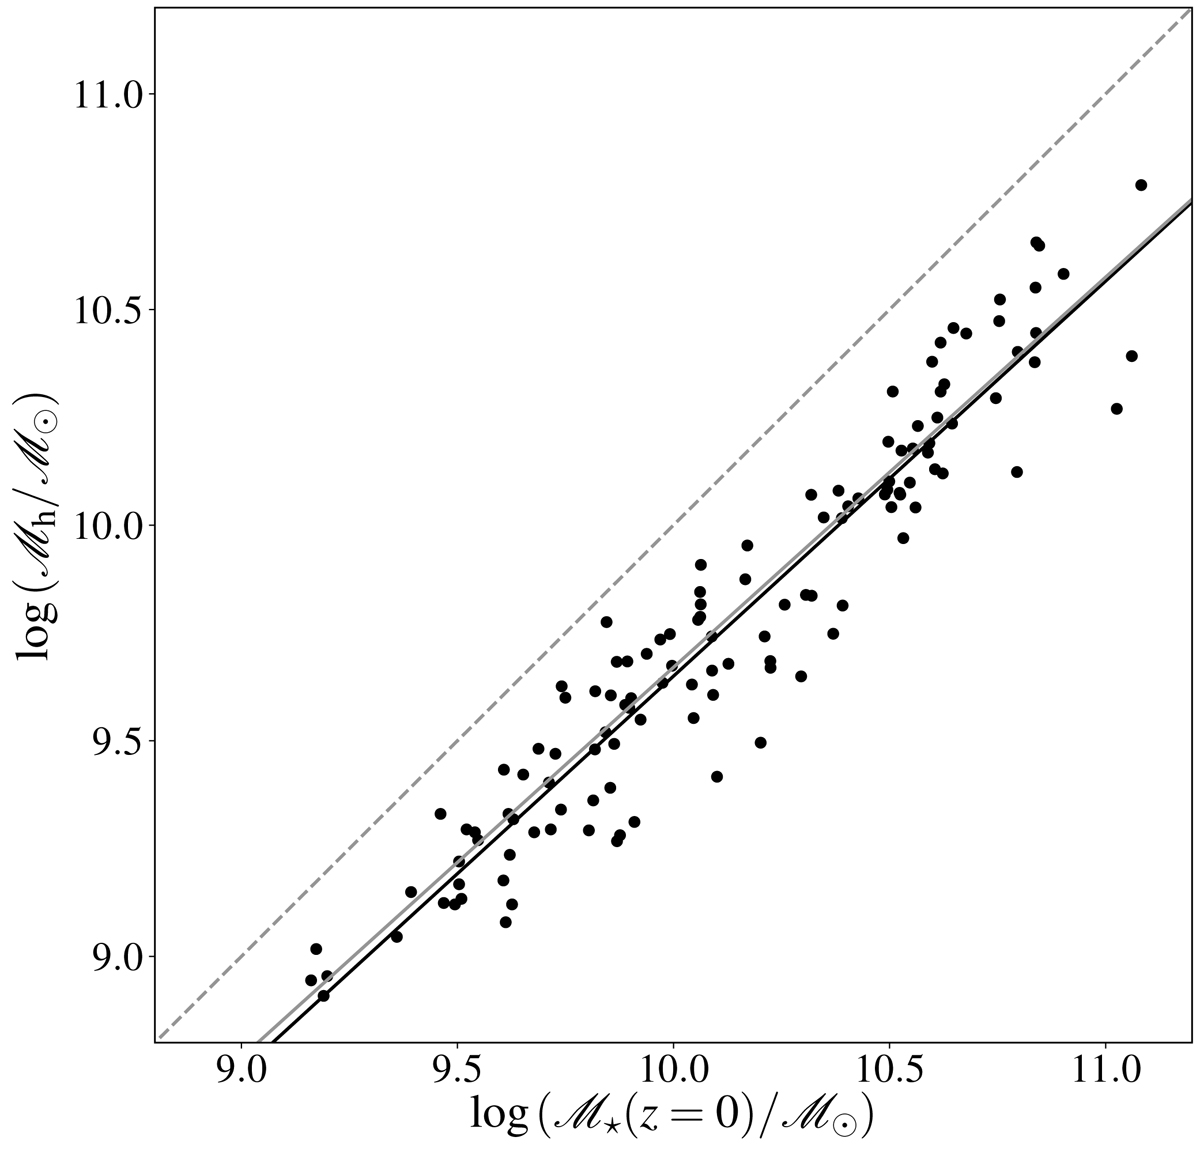
Scatter plot of the sum of the masses of the thick disc and the classical bulge (dynamically hot components; ℳh) versus the total stellar mass of the galaxy, ℳ⋆(z = 0), for the 124 galaxies with a fitted thick disc in Comerón et al. (2018). The black continuous line indicates the linear fit to all the data, whereas the continuous grey line indicates the fit to the data points corresponding to galaxies in the Virgo and Fornax clusters only. The dashed grey line indicates a one-to-one relation.
Current usage metrics show cumulative count of Article Views (full-text article views including HTML views, PDF and ePub downloads, according to the available data) and Abstracts Views on Vision4Press platform.
Data correspond to usage on the plateform after 2015. The current usage metrics is available 48-96 hours after online publication and is updated daily on week days.
Initial download of the metrics may take a while.