Fig. 3.
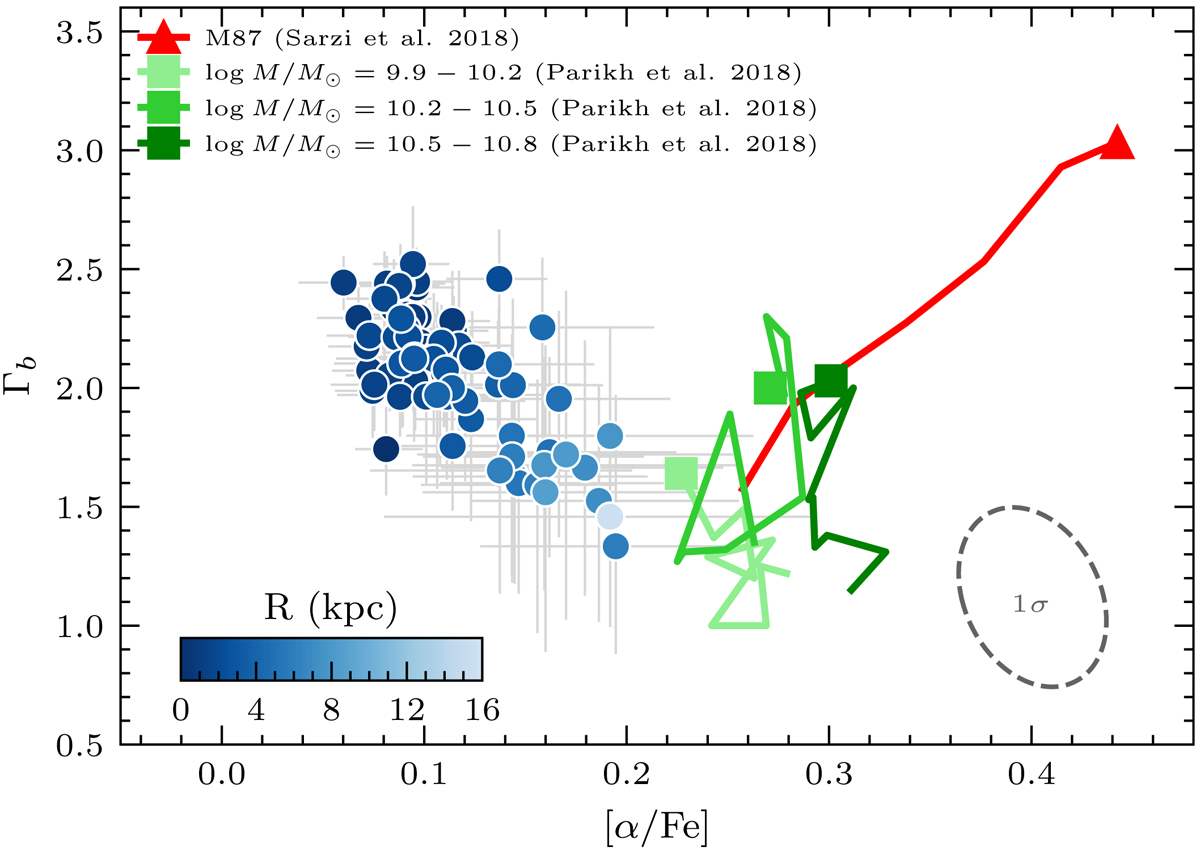
MF slope−[α/Fe] relation. For NGC 3311 (blue points), these two quantities are anti-correlated. This is the opposite of what happens for M 87 (red). However, we stress that in B20 we used full-spectral fitting, rather than line indices as in Sarzi et al. (2018) for M 87, thus measuring a different quantity (using indices, one is much more sensitive to Mg than to the “bulk” changes in all α-elements). We note that the [α/Fe] estimates obtained in Barbosa et al. (2018) from the same data but using line indices imply a high value, which would shift the blue data points toward the red and green lines. The situation is much more complicated for the results based on MaNGA (green lines), where different galaxies, with possibly different [α/Fe] profiles, are stacked together.
Current usage metrics show cumulative count of Article Views (full-text article views including HTML views, PDF and ePub downloads, according to the available data) and Abstracts Views on Vision4Press platform.
Data correspond to usage on the plateform after 2015. The current usage metrics is available 48-96 hours after online publication and is updated daily on week days.
Initial download of the metrics may take a while.