Free Access
Fig. 5.
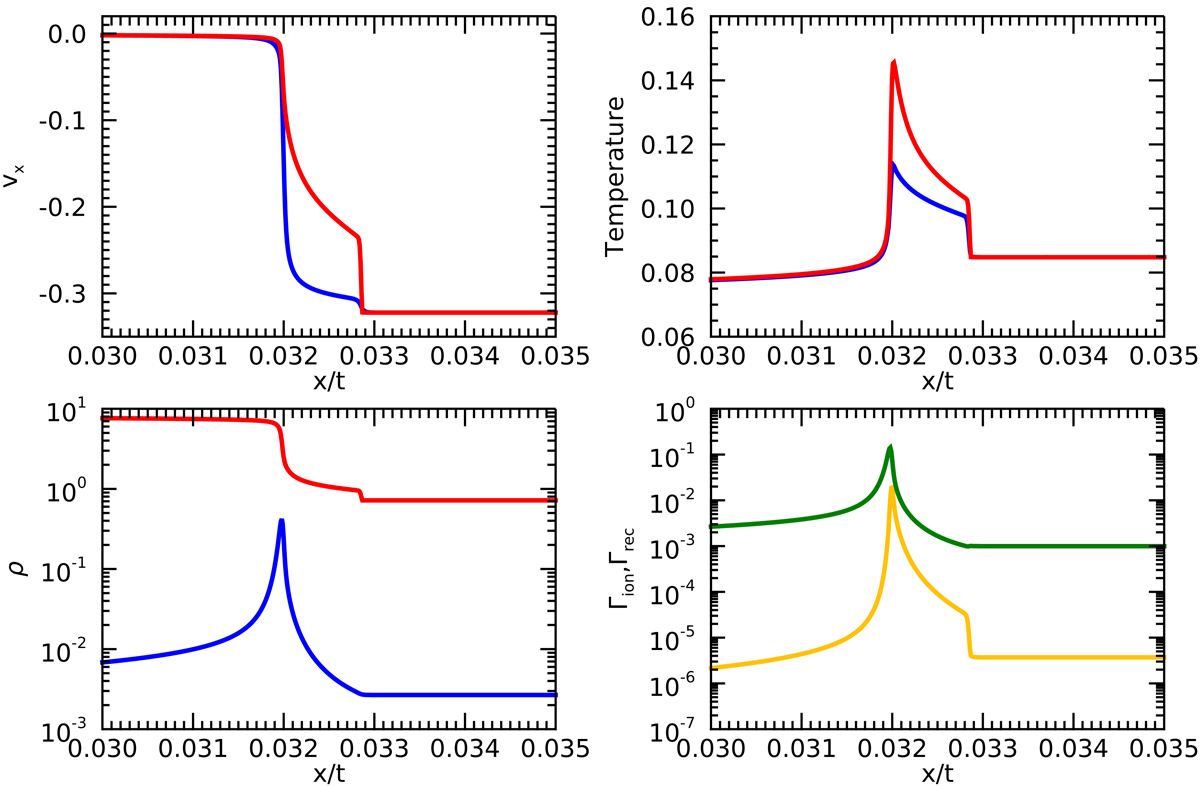
Close-up of the slow-mode shock for the IRIP model showing vx velocity (top left), temperature (top right), and density (lower left) for plasma (blue) and neutral (red) species. Lower right panel: ionisation (orange) and recombination (green) rates.
Current usage metrics show cumulative count of Article Views (full-text article views including HTML views, PDF and ePub downloads, according to the available data) and Abstracts Views on Vision4Press platform.
Data correspond to usage on the plateform after 2015. The current usage metrics is available 48-96 hours after online publication and is updated daily on week days.
Initial download of the metrics may take a while.