Free Access
Fig. 3
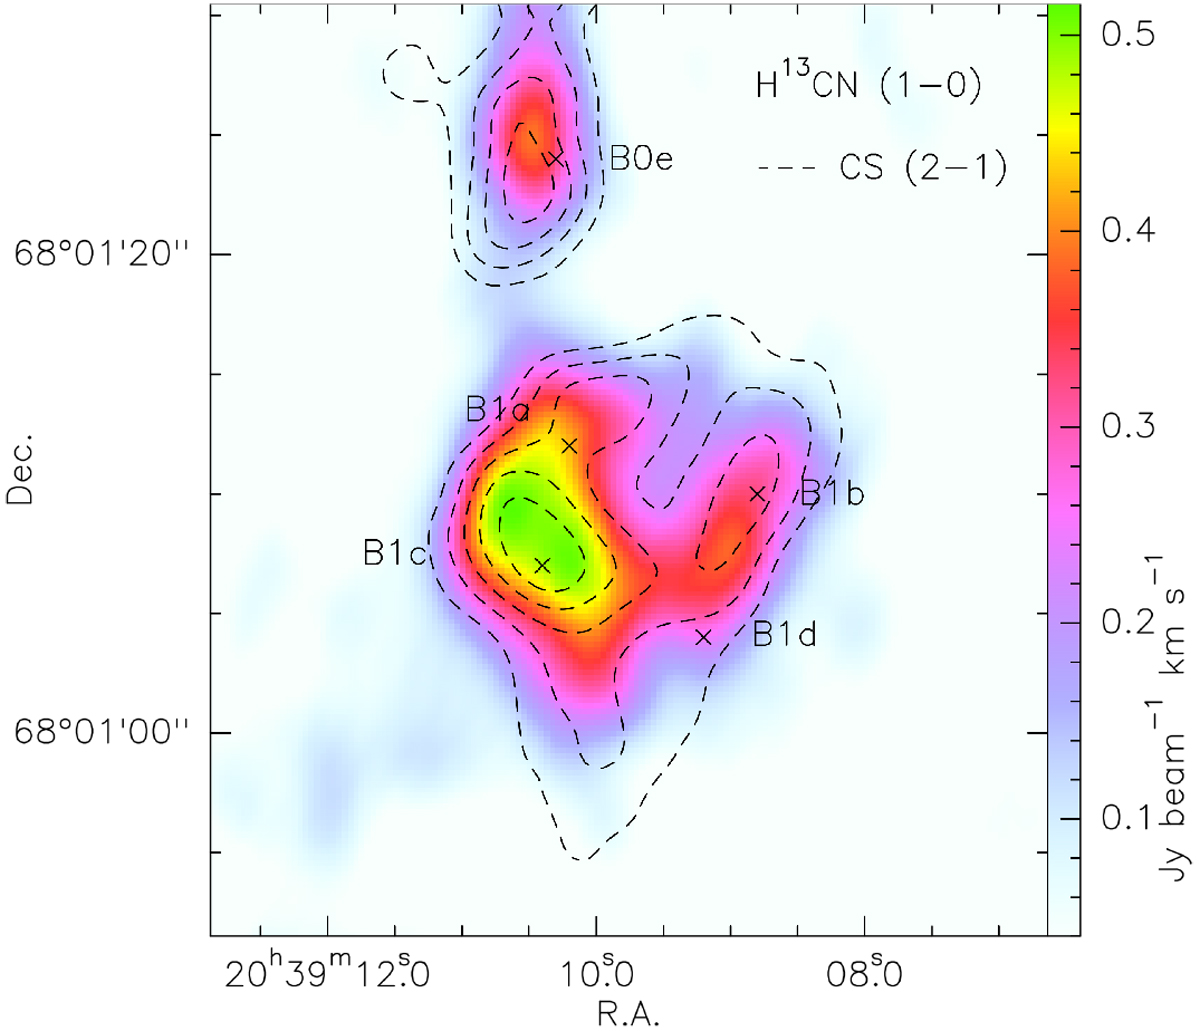
Maps of the CS (2–1) integrated intensity (black dashed contours; Benedettini et al. 2007) over-plotted on the H13CN (1–0) integrated intensity (colour). For CS level steps are equivalent to 3σ, corresponding to 0.026 Jy beam−1 km s−1.
Current usage metrics show cumulative count of Article Views (full-text article views including HTML views, PDF and ePub downloads, according to the available data) and Abstracts Views on Vision4Press platform.
Data correspond to usage on the plateform after 2015. The current usage metrics is available 48-96 hours after online publication and is updated daily on week days.
Initial download of the metrics may take a while.