Fig. 2
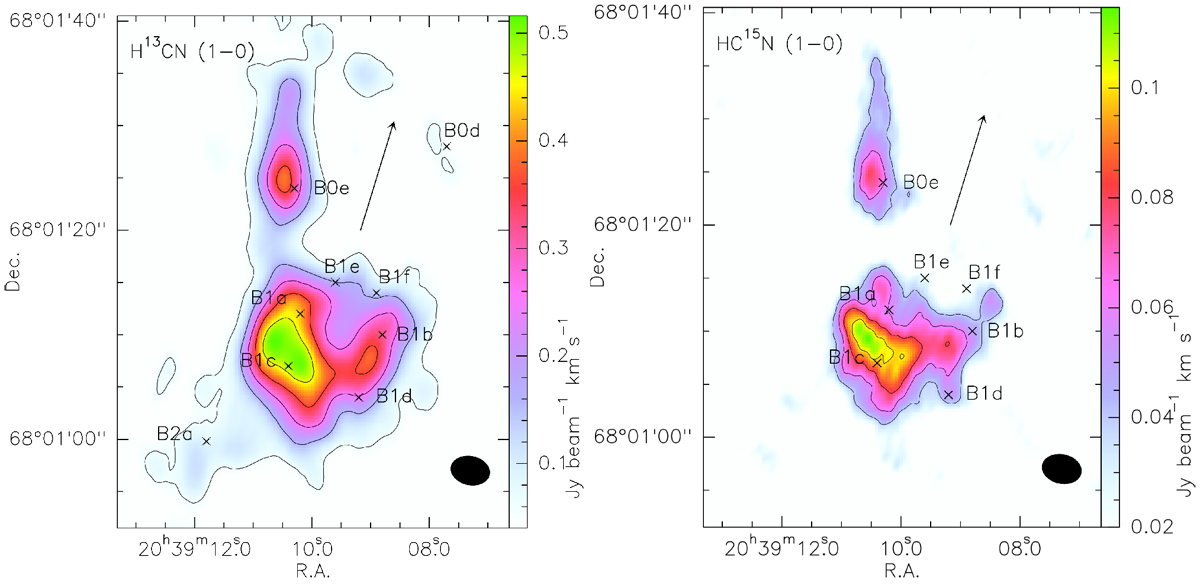
Maps of the H13CN (1–0) integrated intensity between velocity range −21, 12 km s−1 (left panel) and of HC15N (1–0) integrated intensity between velocity range −14, 6 km s−1 (right panel). The synthesized beam, 3. ′′8 × 2. ′′8 (PA = −168°), is shown in the bottom right corner. First level is equivalent to 3σ, corresponding to 0.06 and 0.04 Jy beam−1 km s−1 for H13CN (1–0) and HC15N (1–0), respectively. Level steps are 0.1 and 0.02 Jy beam−1 km s−1 for H13CN (1–0) and HC15N (1–0), respectively. The central position of several clumps (B0d, B0e, B1a, B1b, B1c, B1d, B1e, B1f, and B2a), previously identified with other molecular tracers (Benedettini et al. 2007; Codella et al. 2015), is indicated by a cross and the arrow indicates the direction towards the driving source L1157-mm.
Current usage metrics show cumulative count of Article Views (full-text article views including HTML views, PDF and ePub downloads, according to the available data) and Abstracts Views on Vision4Press platform.
Data correspond to usage on the plateform after 2015. The current usage metrics is available 48-96 hours after online publication and is updated daily on week days.
Initial download of the metrics may take a while.