Free Access
Fig. 1
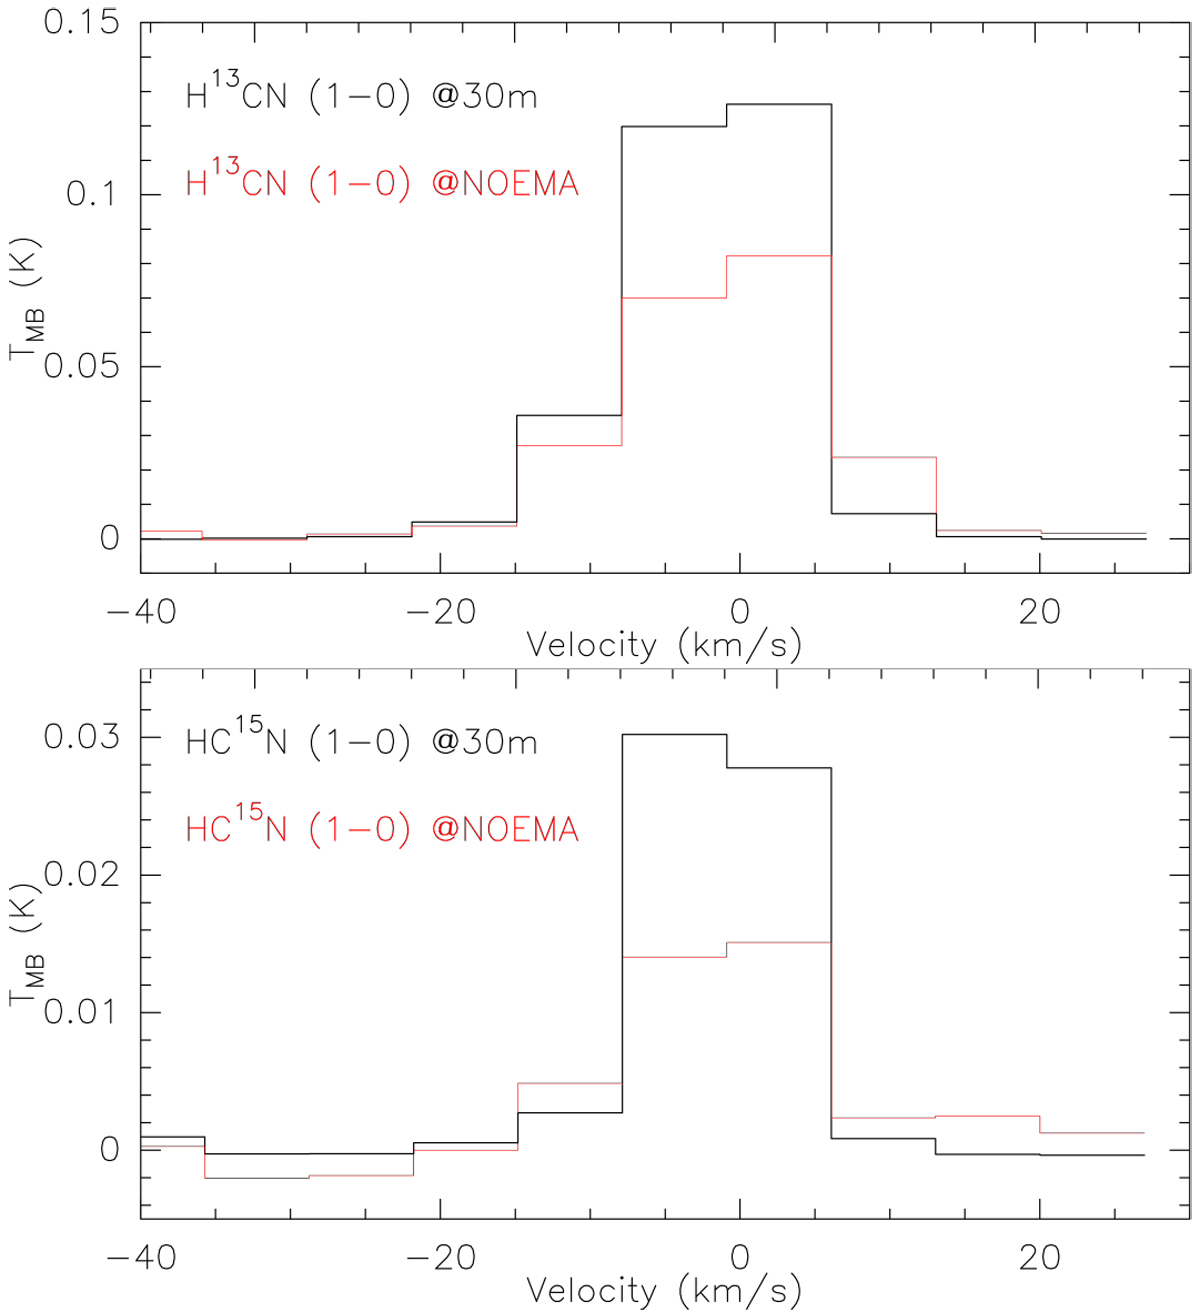
Comparison of spectra observed with the single-dish IRAM 30 m telescope towards L1157-B1 (black) and extracted from the NOEMA cube (red) in a circle equivalent to the HPBW = 28′′.5 of the IRAM 30 m telescope and centred in B1. Top panel: spectra of the H13CN (1–0) line. Bottom panel: spectra of the HC15N (1–0) line.
Current usage metrics show cumulative count of Article Views (full-text article views including HTML views, PDF and ePub downloads, according to the available data) and Abstracts Views on Vision4Press platform.
Data correspond to usage on the plateform after 2015. The current usage metrics is available 48-96 hours after online publication and is updated daily on week days.
Initial download of the metrics may take a while.