Fig. 7
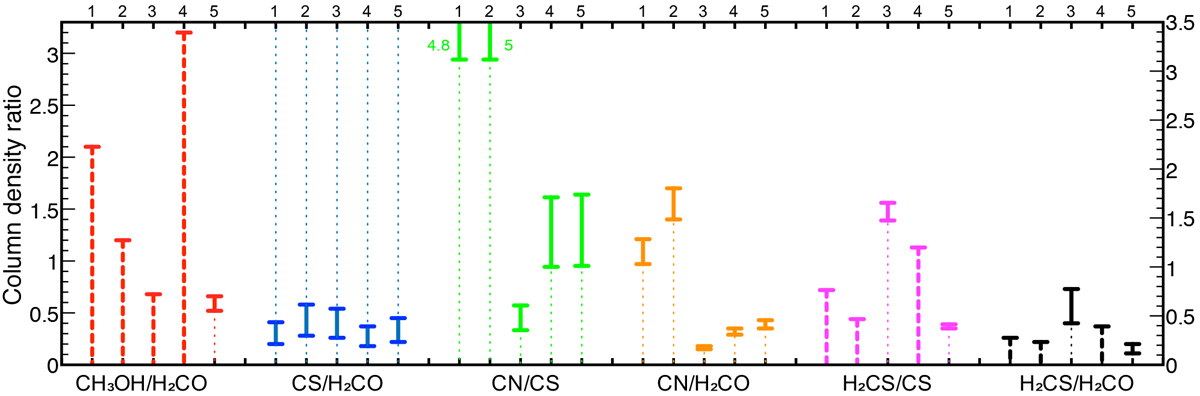
Column density ratios. Continuous lines indicate the range of solutions found in the hypothesis of optically thin lines in the range of gas temperature 20−100 K. Dashed lines indicate upper limits from undetected lines. The possibility that CS and H2 CO lines are optically thick is reflected by the thin dotted lines. When a bar falls outside of the diagram, the upper limit is indicated. Sources are ordered as (1) DG Tau, (2) DG Tau B, (3) HL Tau, (4) Haro 6-13, and (5) IRAS 04302.
Current usage metrics show cumulative count of Article Views (full-text article views including HTML views, PDF and ePub downloads, according to the available data) and Abstracts Views on Vision4Press platform.
Data correspond to usage on the plateform after 2015. The current usage metrics is available 48-96 hours after online publication and is updated daily on week days.
Initial download of the metrics may take a while.