Fig. 5
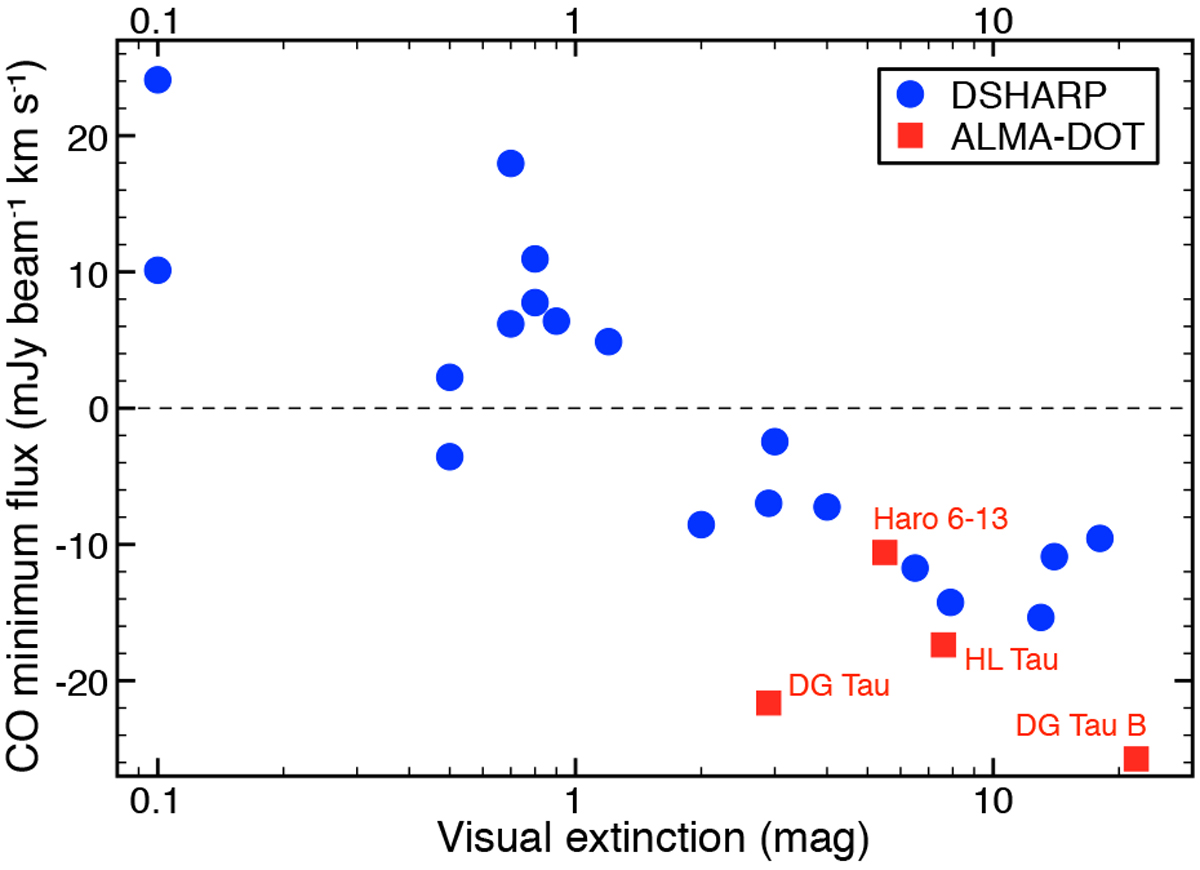
Minimum flux recorded in the center of the CO continuum-subtracted moment 0 map related to the visual extinction. Fluxes are recalculated after scaling each source to the same distance (140 pc) and beam size (0.1′′ × 0.1′′). IRAS 04302is not included because of the edge-on geometry of the disk largely contributing to the high optical extinction.
Current usage metrics show cumulative count of Article Views (full-text article views including HTML views, PDF and ePub downloads, according to the available data) and Abstracts Views on Vision4Press platform.
Data correspond to usage on the plateform after 2015. The current usage metrics is available 48-96 hours after online publication and is updated daily on week days.
Initial download of the metrics may take a while.