Fig. 4
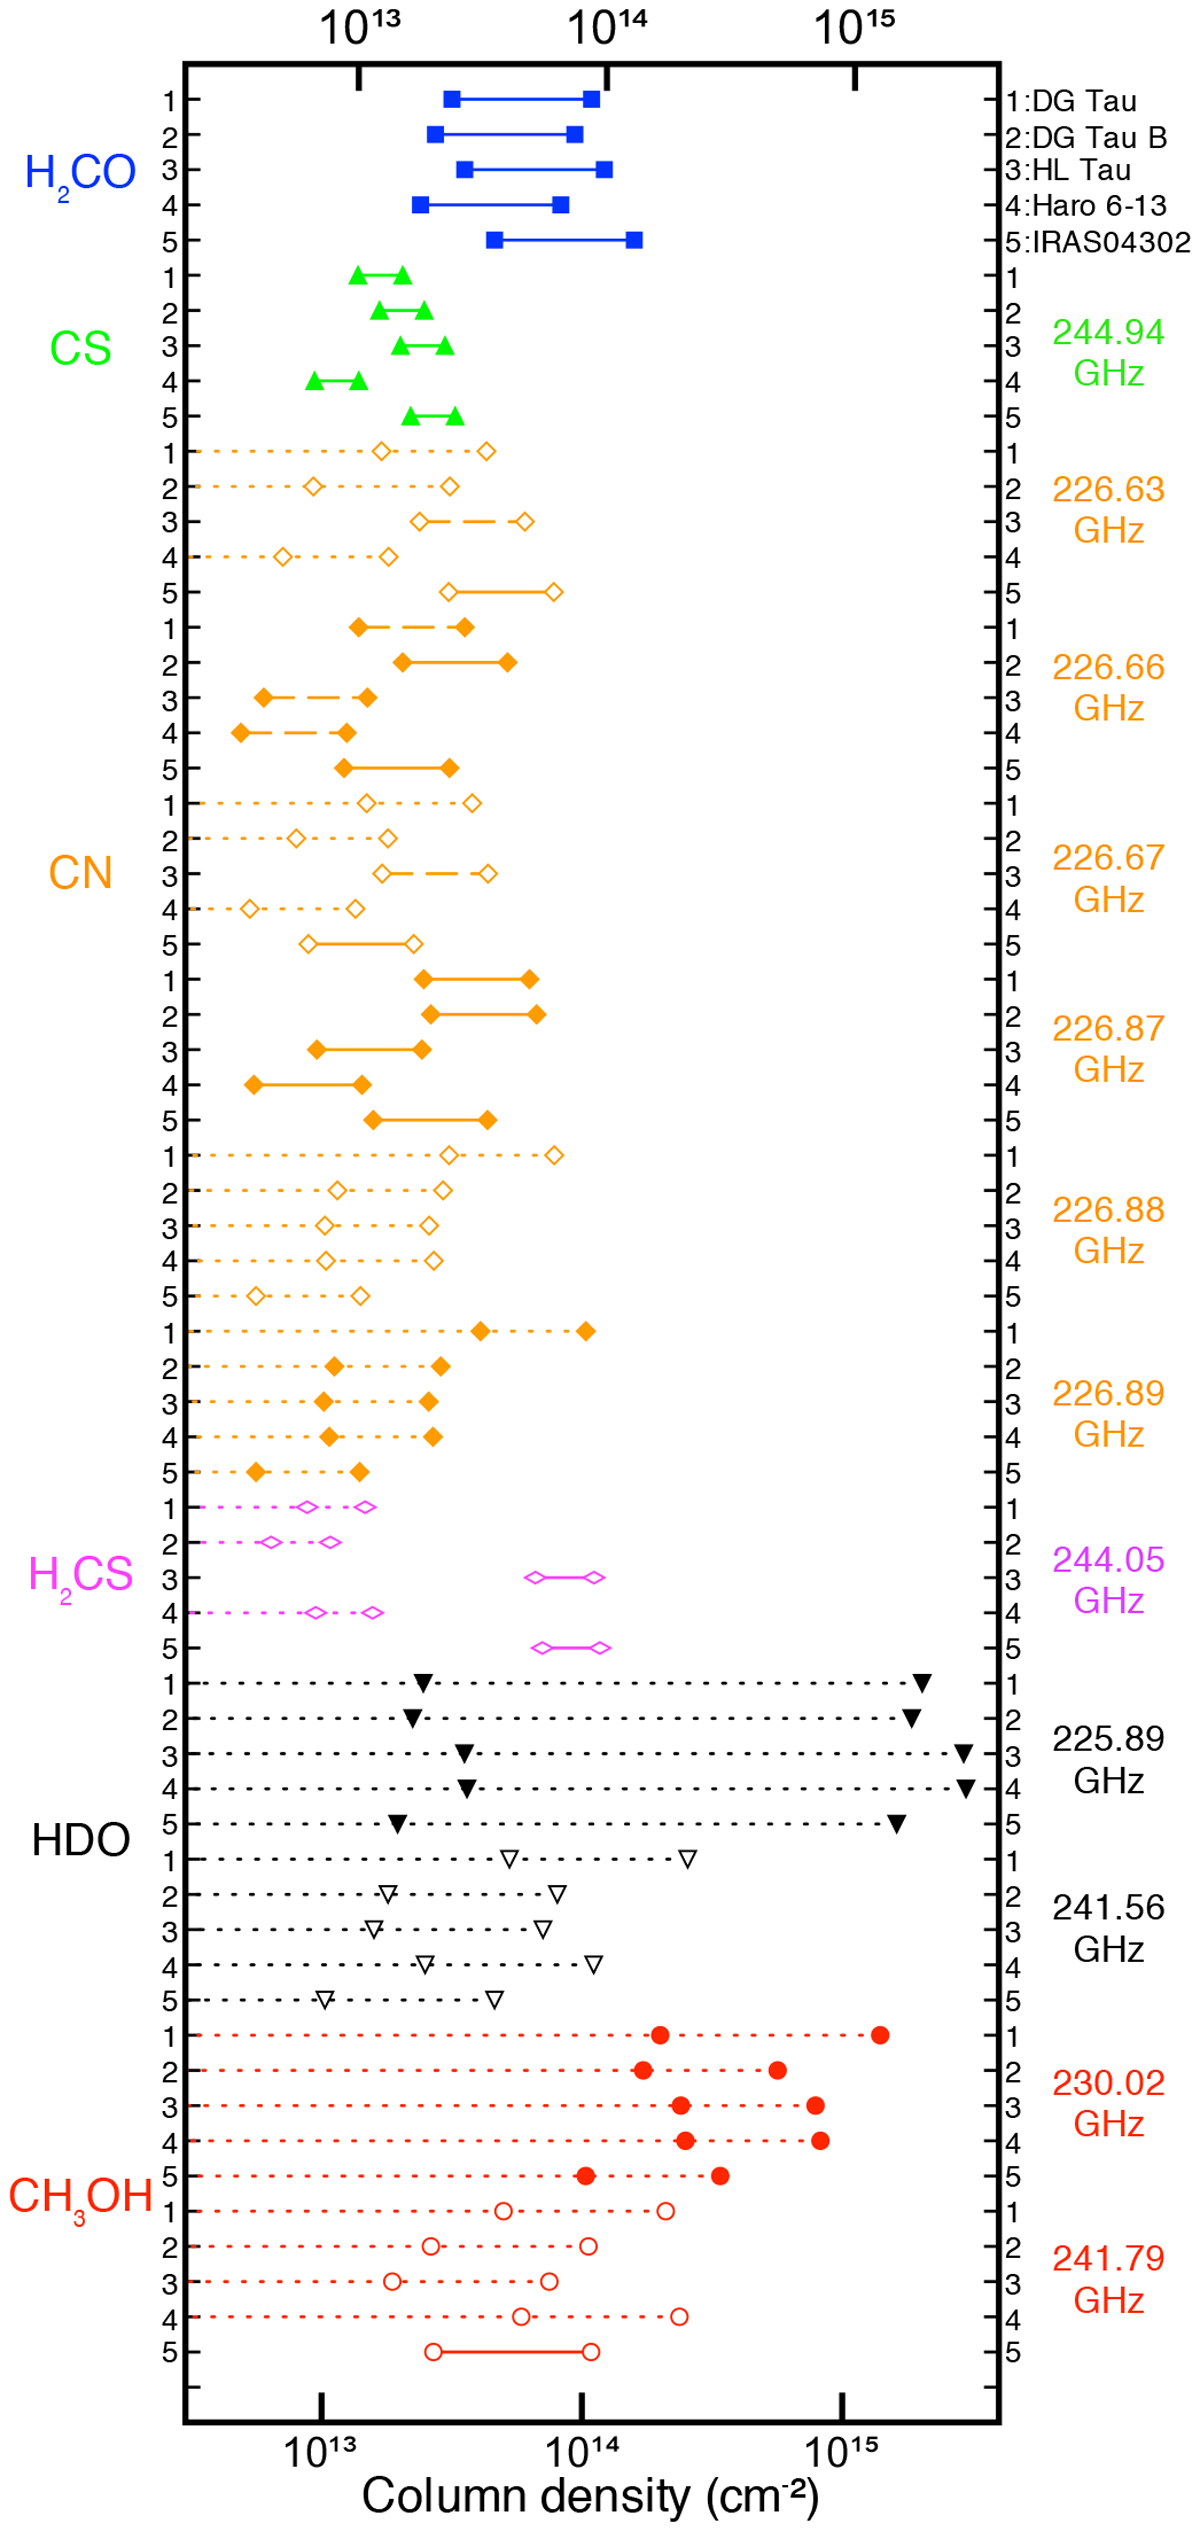
Column densities of all molecules calculated in the hypothesis of optically thin lines and LTE conditions. The rangeof solutions is obtained over the relative emitting region only and reflects the minimum and maximum values found over a range of temperatures between 20 and 100 K. Dotted lines indicate the upper limits derived from the undetected lines. Dashed lines indicate column densities constrained from 2σ detections. Filled and empty symbols are drawn for an easier reading of different lines.
Current usage metrics show cumulative count of Article Views (full-text article views including HTML views, PDF and ePub downloads, according to the available data) and Abstracts Views on Vision4Press platform.
Data correspond to usage on the plateform after 2015. The current usage metrics is available 48-96 hours after online publication and is updated daily on week days.
Initial download of the metrics may take a while.