Fig. 3
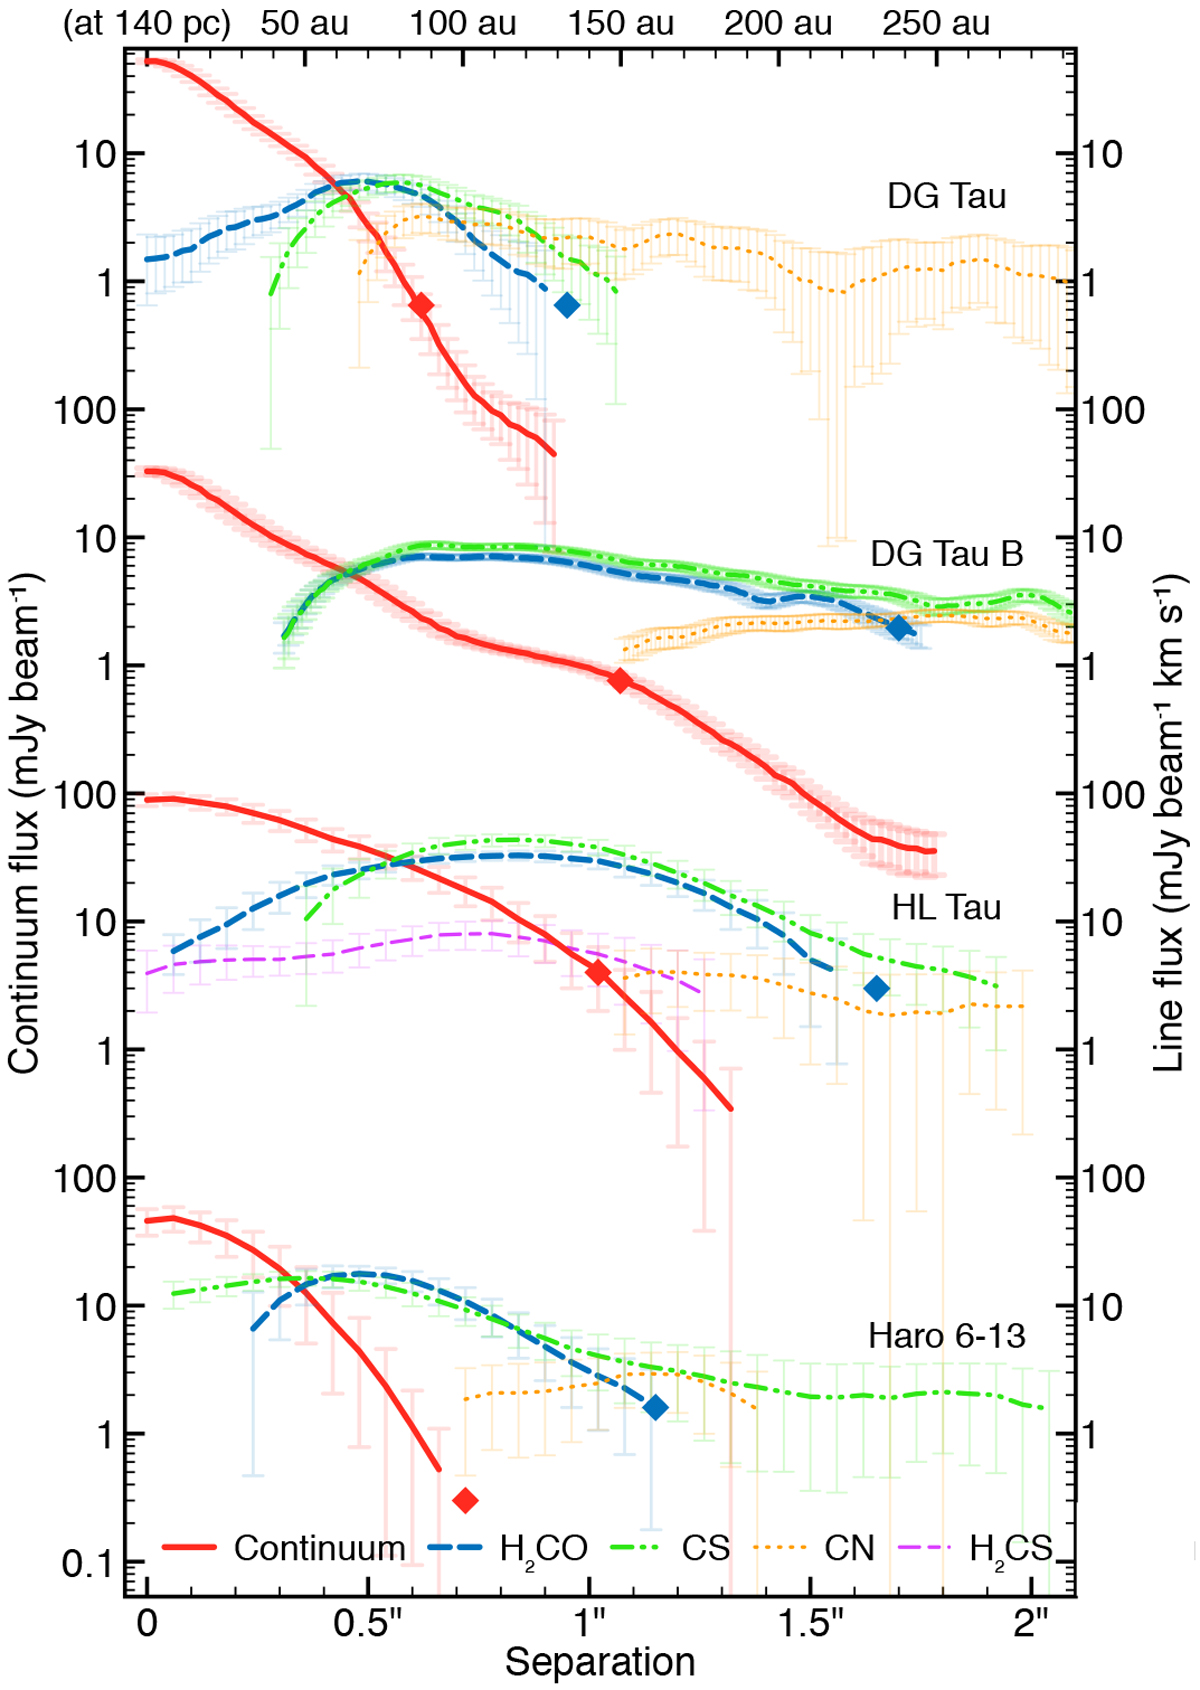
Radial profile of the continuum and spectral line emission, obtained from the azimuthal average as described in Sect. 4.3.2. A vertical offset among objects has been put for better visualization. Error bars are obtained by propagating the uncertainties at all angles and do not include the dispersion of the averaged sample. Only fluxes above 3σ confidence are shown. The red and blue diamonds indicate the dust and gas outer radii constrained from the 90%-flux method (seetext). The physical scale shown at top are indicative for a distance of 140 pc, although sources are spread around this value (see Table 1).
Current usage metrics show cumulative count of Article Views (full-text article views including HTML views, PDF and ePub downloads, according to the available data) and Abstracts Views on Vision4Press platform.
Data correspond to usage on the plateform after 2015. The current usage metrics is available 48-96 hours after online publication and is updated daily on week days.
Initial download of the metrics may take a while.