Fig. 2
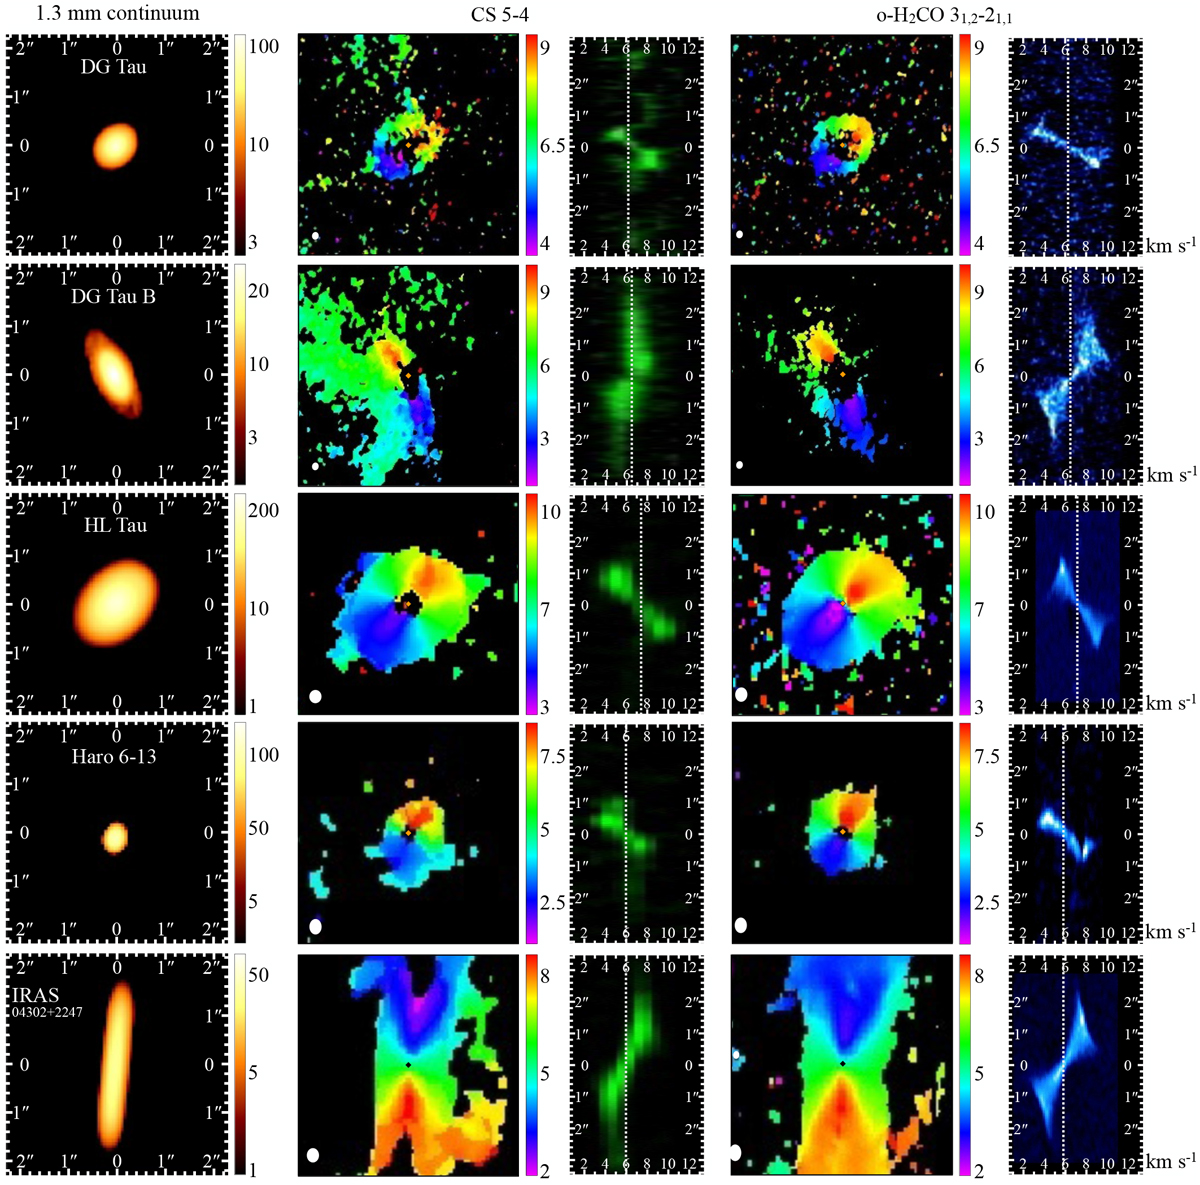
Kinematical overview of the sample. The intensity-weighted velocity maps (moment 1, square panels) and position-velocity diagrams (PV, vertical panels) of the CS and H2 CO molecular emission are shown for the sample analyzed in this work along with the continuum emission of Fig. 1. Moment 1 maps are obtained by clipping fluxes below 3σ. PV diagrams are obtained over the disk major axis taking a width as large as the projected gaseous disk size (see Table 3) along the minor axis. The color units of the moment 1 maps are in km s−1, those of the PV diagrams are the same of Fig. 1. The x-axis of the PV diagrams is in km s−1. The symbols in the center of the images indicate the geometrical center of the continuum emission. The beam size is indicated to the bottom-left corner of each panel. The vertical dashed lines indicate the systemic velocities of the system (see Appendix C). All moment 0 and 1 maps have the same angular scale, as indicated in the leftmost column. North is up, east is left.
Current usage metrics show cumulative count of Article Views (full-text article views including HTML views, PDF and ePub downloads, according to the available data) and Abstracts Views on Vision4Press platform.
Data correspond to usage on the plateform after 2015. The current usage metrics is available 48-96 hours after online publication and is updated daily on week days.
Initial download of the metrics may take a while.