Fig. 1
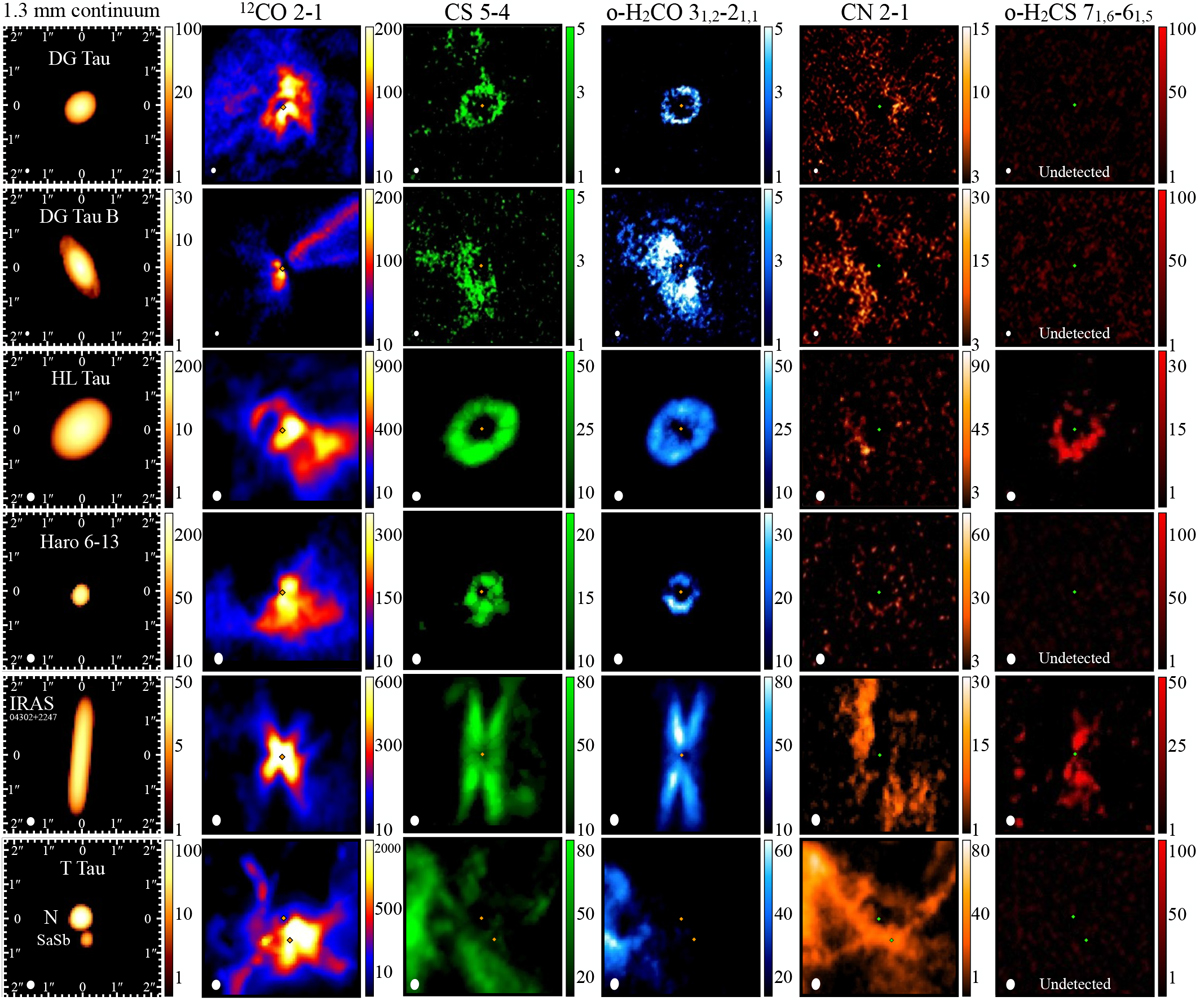
Morphological overview of the sample. Continuum and molecular emission from 12 CO, CS, H2 CO, CN, and H2CS is shown for the whole sample. Images of spectral lines are the flux-integrated map (moment 0) obtained by clipping fluxes below 3σ (the CO, CS, and H2CO), 2σ (the CN and detected H2CS), or without any clip (the undetected H2CS). Continuum fluxes are expressed in mJy beam−1 while line fluxes in mJy beam−1 km s−1. The symbols in the center of the images indicate the geometrical center of the continuum emission. The beam size is indicated tothe bottom-left corner of each panel. All images have the same angular scale, as indicated in the leftmost column. North is up, east is left.
Current usage metrics show cumulative count of Article Views (full-text article views including HTML views, PDF and ePub downloads, according to the available data) and Abstracts Views on Vision4Press platform.
Data correspond to usage on the plateform after 2015. The current usage metrics is available 48-96 hours after online publication and is updated daily on week days.
Initial download of the metrics may take a while.