Free Access
Fig. 9
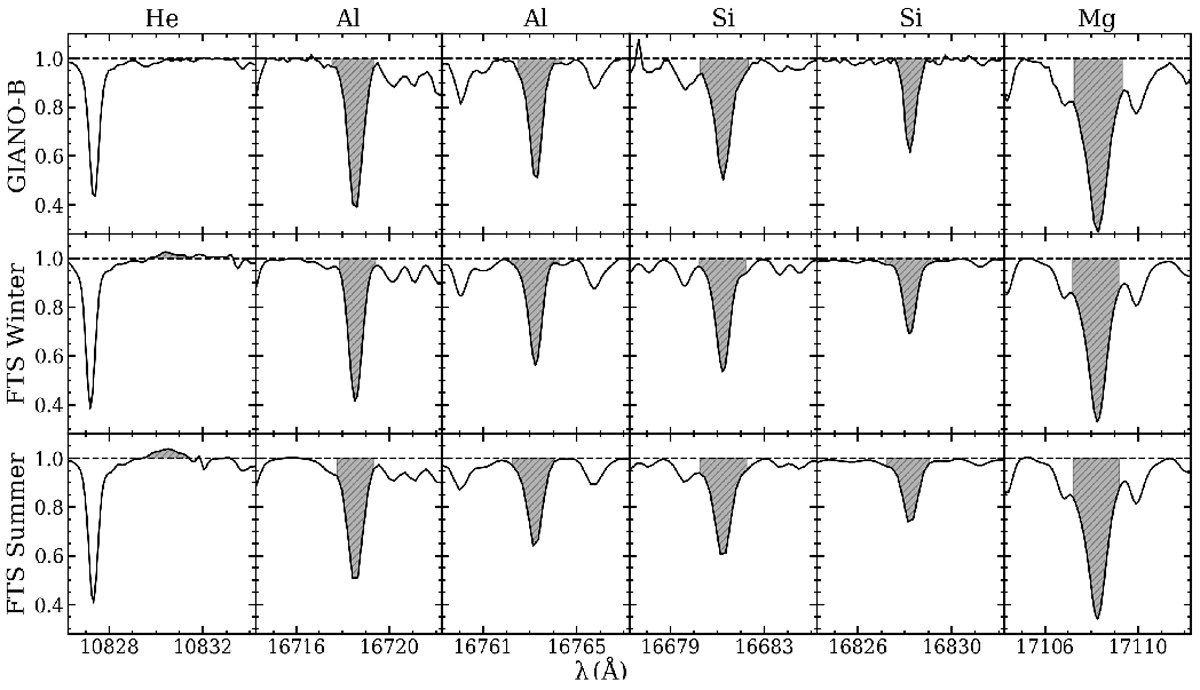
Chromospheric He I line in the Y band and a few strong photospheric Al, Si, and Mg lines in the in the GIANO-B spectrum (top panel) and in the winter, January (middle panel) and summer, June (bottom panel) FTS spectra by Hinkle & Wallace (2005).
Current usage metrics show cumulative count of Article Views (full-text article views including HTML views, PDF and ePub downloads, according to the available data) and Abstracts Views on Vision4Press platform.
Data correspond to usage on the plateform after 2015. The current usage metrics is available 48-96 hours after online publication and is updated daily on week days.
Initial download of the metrics may take a while.