Fig. 6
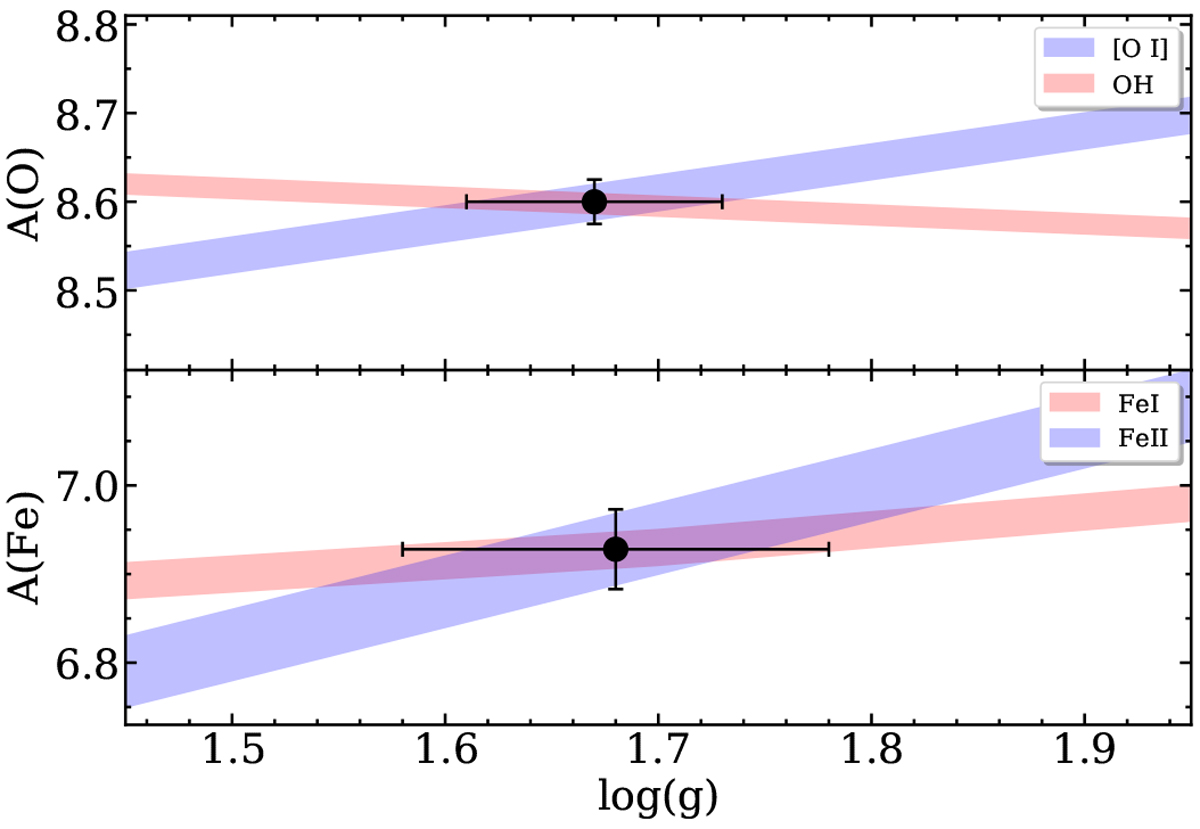
Top panel: best-fit trends of Oxygen abundances from the [O I] line (blue) and from the OH lines (red) with gravity. The black dot marks the intersection of the two curves, and its x-coordinate provides the best-fit log (g) = 1.67 ± 0.06. Bottom panel: best-fit trends of Iron abundances from Fe II (shaded) and Fe I lines (red) with gravity. The black dot marks the intersection of the two curves, and its x-coordinate provides the best-fit log (g) = 1.68 ± 0.10.
Current usage metrics show cumulative count of Article Views (full-text article views including HTML views, PDF and ePub downloads, according to the available data) and Abstracts Views on Vision4Press platform.
Data correspond to usage on the plateform after 2015. The current usage metrics is available 48-96 hours after online publication and is updated daily on week days.
Initial download of the metrics may take a while.