Free Access
Fig. 5
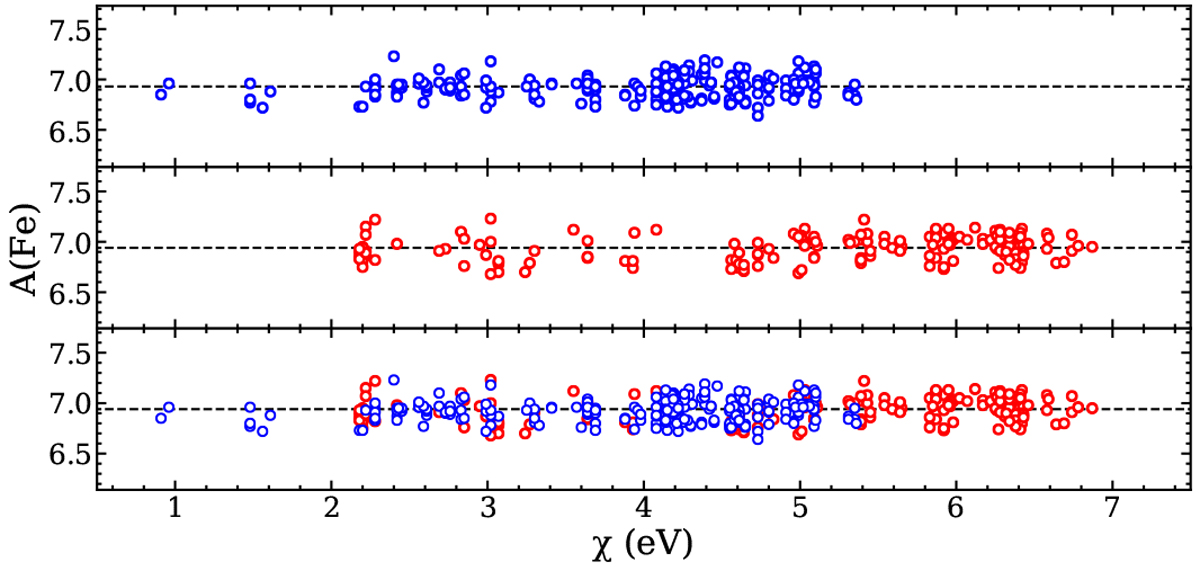
Iron abundances from neutral lines in the optical UVES spectra (blue circles) and in the NIR GIANO-B spectrum (red circles) as a function of their excitation potential. The dotted line marks the derived best-fit median iron abundance.
Current usage metrics show cumulative count of Article Views (full-text article views including HTML views, PDF and ePub downloads, according to the available data) and Abstracts Views on Vision4Press platform.
Data correspond to usage on the plateform after 2015. The current usage metrics is available 48-96 hours after online publication and is updated daily on week days.
Initial download of the metrics may take a while.