Fig. 4
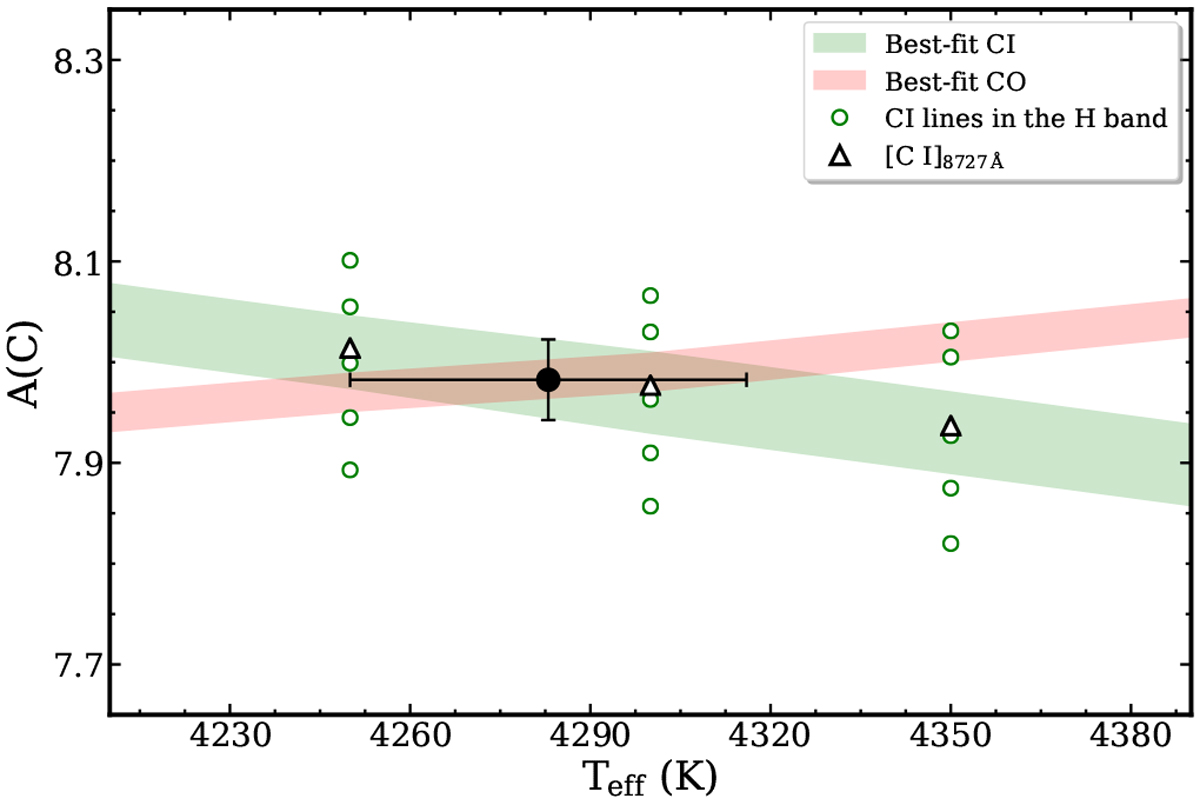
C abundances as a function of temperature from the C I lines in the H band (green circles), and the forbidden [C I] line at 8727.14 Å (empty triangle). The shaded green region is the corresponding best-fit ±1σ trend of the C I lines, while the shaded red region is the best-fit ±1σ trend of theCO lines. The large black dot marks the intersection of the two curves, and its x-coordinate provides the best-fit temperature.
Current usage metrics show cumulative count of Article Views (full-text article views including HTML views, PDF and ePub downloads, according to the available data) and Abstracts Views on Vision4Press platform.
Data correspond to usage on the plateform after 2015. The current usage metrics is available 48-96 hours after online publication and is updated daily on week days.
Initial download of the metrics may take a while.