Fig. 10
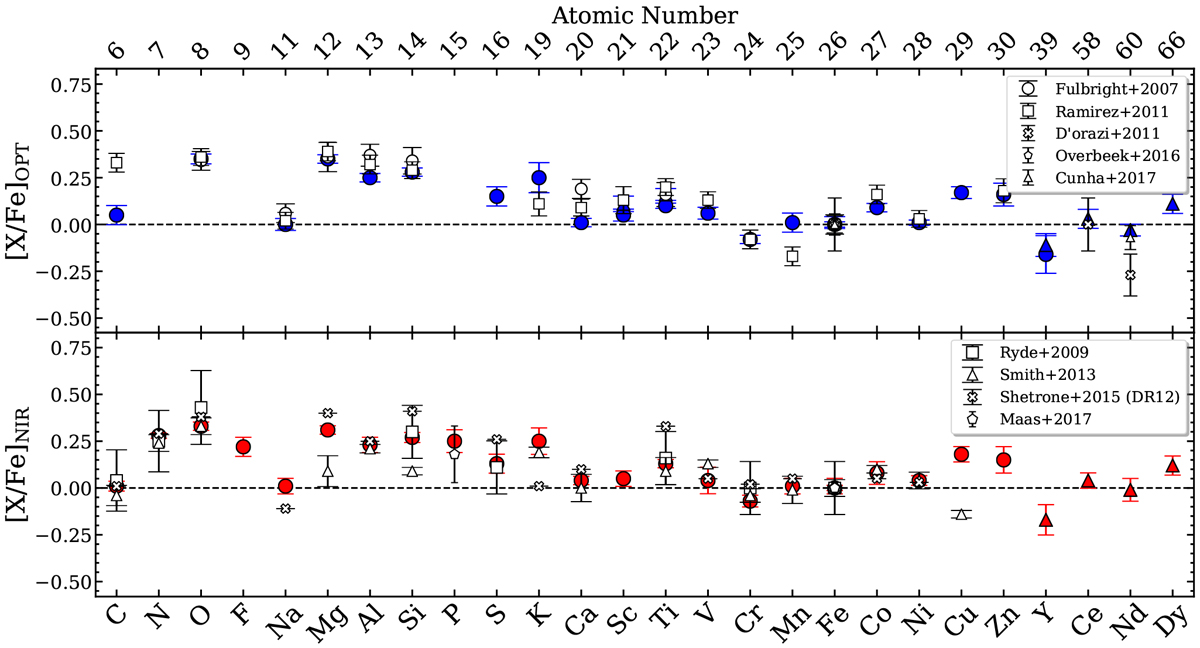
Derived [X/Fe] chemical abundances for Arcturus from some optical (top panel) and NIR (bottom panel) studies quoted in Table 1 and in Sect. 1. Blue symbols are our abundances from the optical UVES spectra, and red symbols our abundances from the NIR GIANO-B spectrum. Blue and red dots refer to neutral species, and blue and red triangles to ionised species.
Current usage metrics show cumulative count of Article Views (full-text article views including HTML views, PDF and ePub downloads, according to the available data) and Abstracts Views on Vision4Press platform.
Data correspond to usage on the plateform after 2015. The current usage metrics is available 48-96 hours after online publication and is updated daily on week days.
Initial download of the metrics may take a while.