Fig. 7.
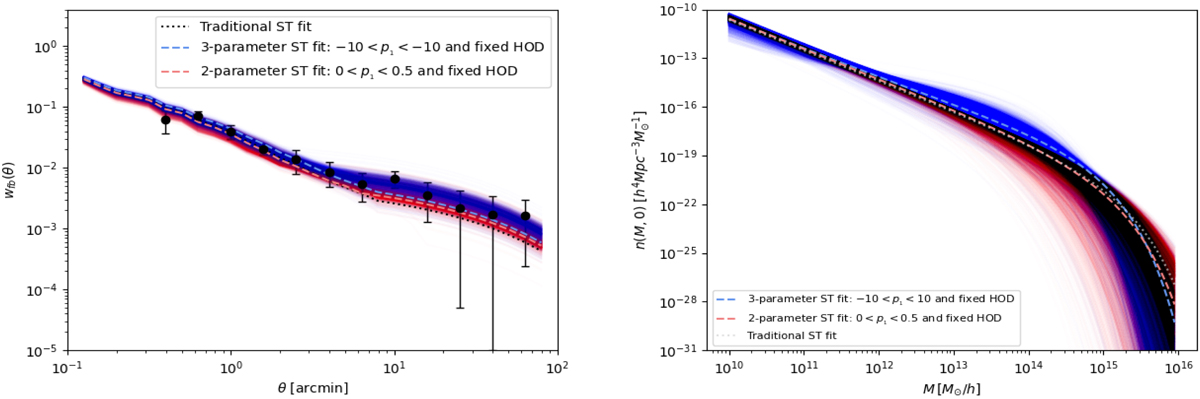
Full posterior sampling (solid lines) and (mimic) marginal mode values (dashed lines) from runs 1 (in red) and 7 (in blue) of the MCMC algorithm, that is, a two-parameter fixed HOD ST fit with p1 > 0 and a three-parameter fixed HOD ST fit with p1 allowed to be negative, respectively. Left panel: cross-correlation function (the black filled circles being our measurements), right panel: z = 0 HMF. The dotted grey line corresponds to the traditional ST fit.
Current usage metrics show cumulative count of Article Views (full-text article views including HTML views, PDF and ePub downloads, according to the available data) and Abstracts Views on Vision4Press platform.
Data correspond to usage on the plateform after 2015. The current usage metrics is available 48-96 hours after online publication and is updated daily on week days.
Initial download of the metrics may take a while.