Fig. 7.
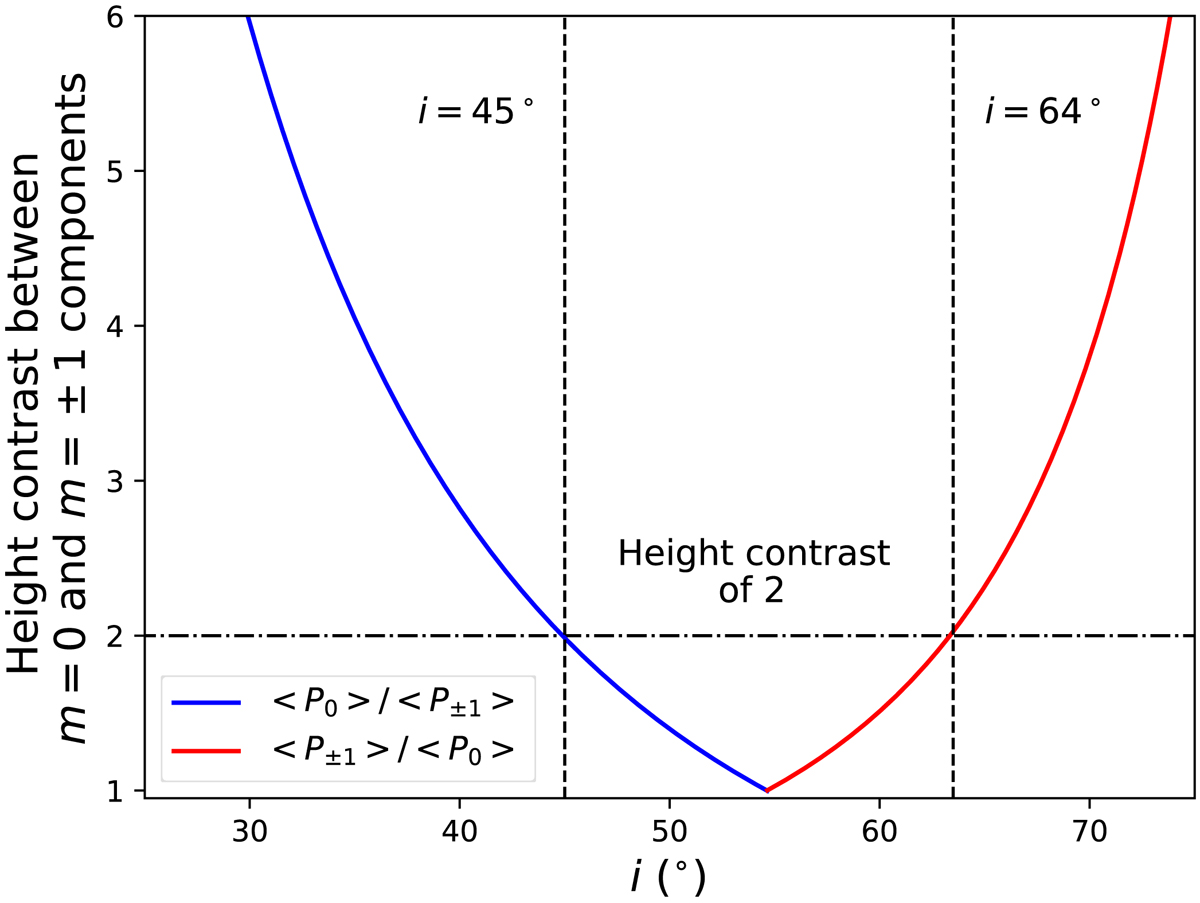
Evolution with inclination of the height contrast between rotational components with azimuthal orders 0 and ±1. The blue line represents the contrast ⟨P0⟩/⟨P±1⟩ computed from Eq. (12), while the red line represents the contrast ⟨P±1⟩/⟨P0⟩. Vertical dashed lines indicate inclinations of 45 and 64°, while the horizontal dot-dashed line indicates a height contrast of 2.
Current usage metrics show cumulative count of Article Views (full-text article views including HTML views, PDF and ePub downloads, according to the available data) and Abstracts Views on Vision4Press platform.
Data correspond to usage on the plateform after 2015. The current usage metrics is available 48-96 hours after online publication and is updated daily on week days.
Initial download of the metrics may take a while.