Fig. B.1.
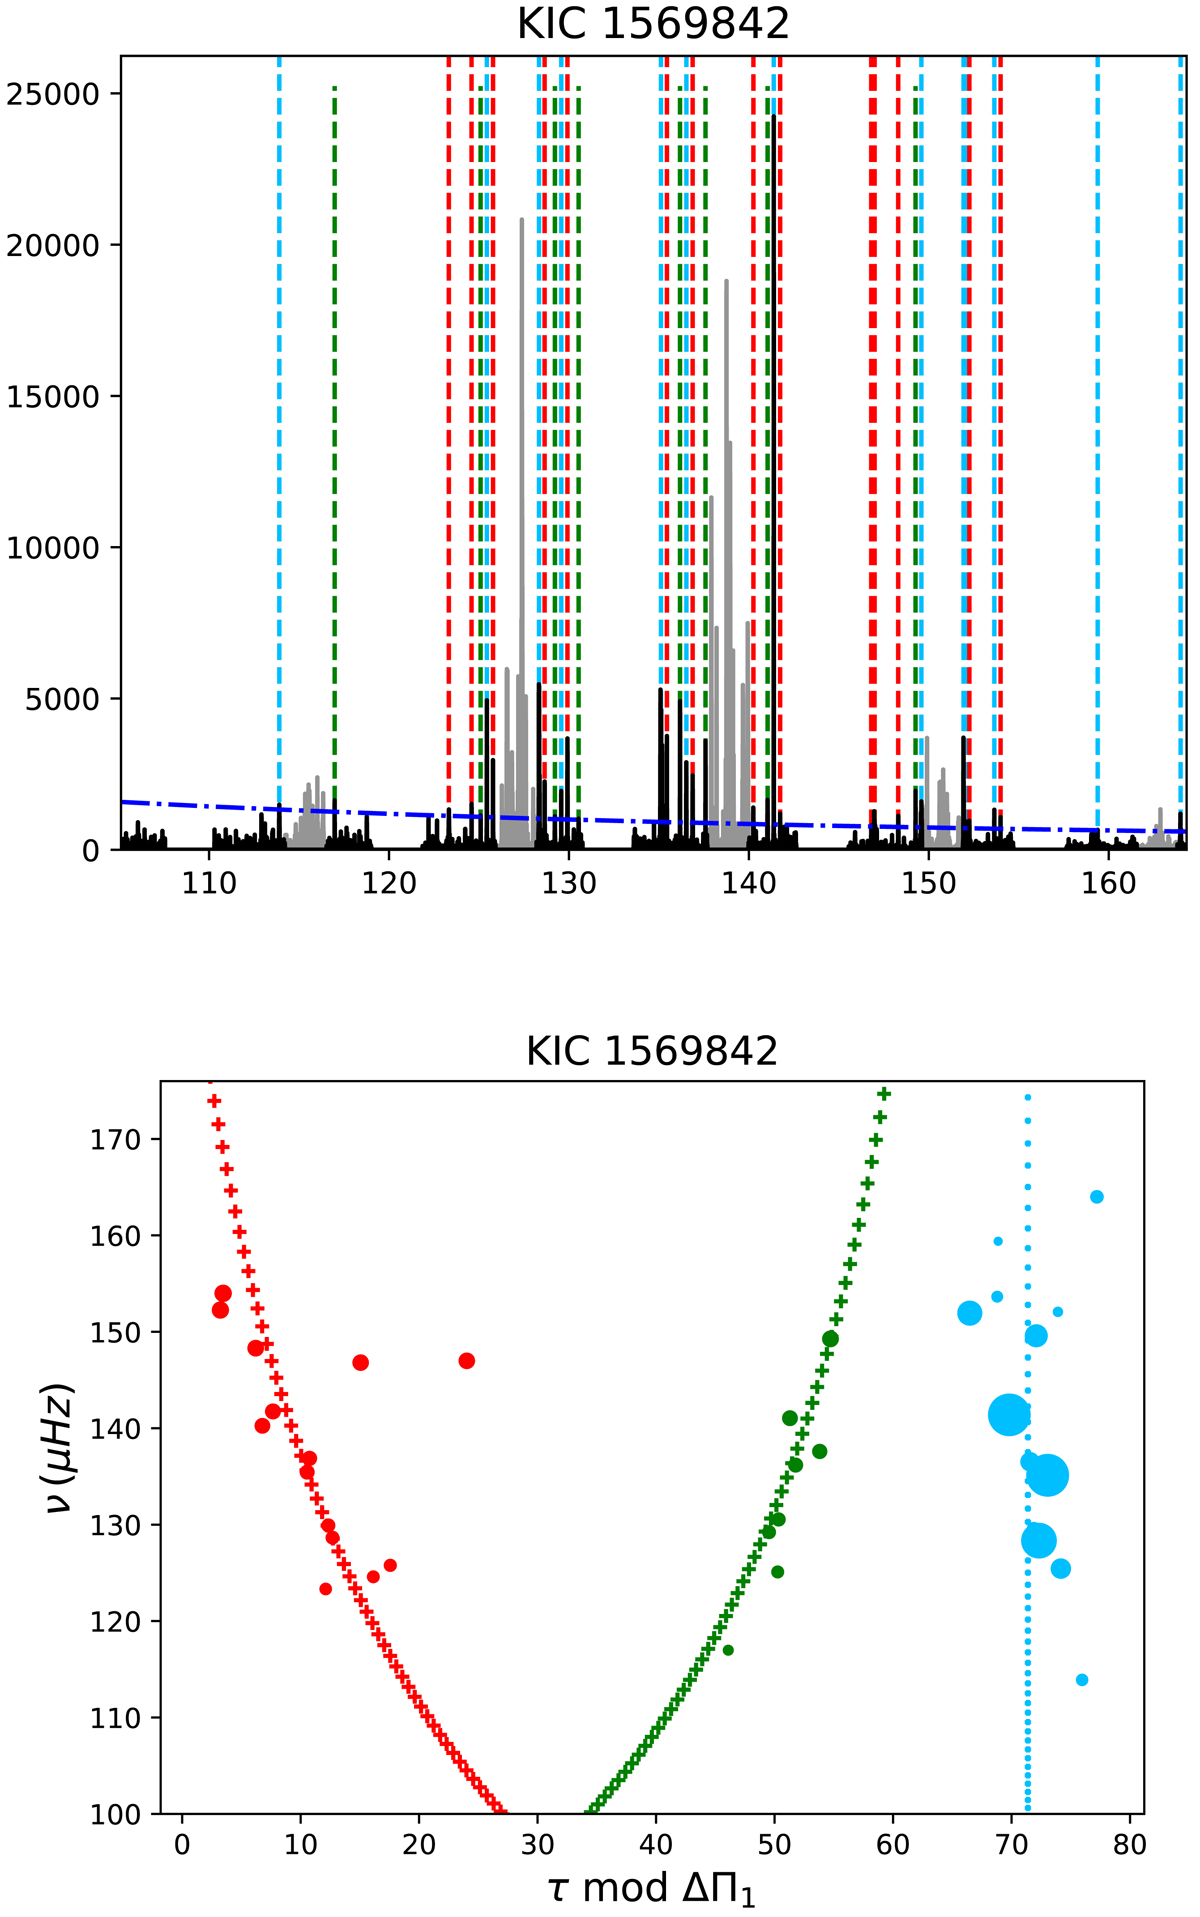
KIC 1569842 with three observed rotational components. We found an inclination of i = 32.5 ± 13.8°. Upper panel: oscillation spectrum where frequency intervals around radial and quadrupole modes have been removed. The horizontal blue dashed-line indicates the level above which oscillation modes are considered as significant. Pressure-dominated mixed-modes are in grey, gravity-dominated mixed-modes are in black. Modes with azimuthal orders m = { − 1, 0, 1} are indicated by vertical dashed lines in green, light blue and red, respectively. Lower panel: échelle diagram in stretched period with same color code. Observed modes are represented by dots and the symbol size varies as the measured power spectral density. The fit of rotational components are represented by crosses with the color coding the azimuthal order.
Current usage metrics show cumulative count of Article Views (full-text article views including HTML views, PDF and ePub downloads, according to the available data) and Abstracts Views on Vision4Press platform.
Data correspond to usage on the plateform after 2015. The current usage metrics is available 48-96 hours after online publication and is updated daily on week days.
Initial download of the metrics may take a while.