Fig. 8
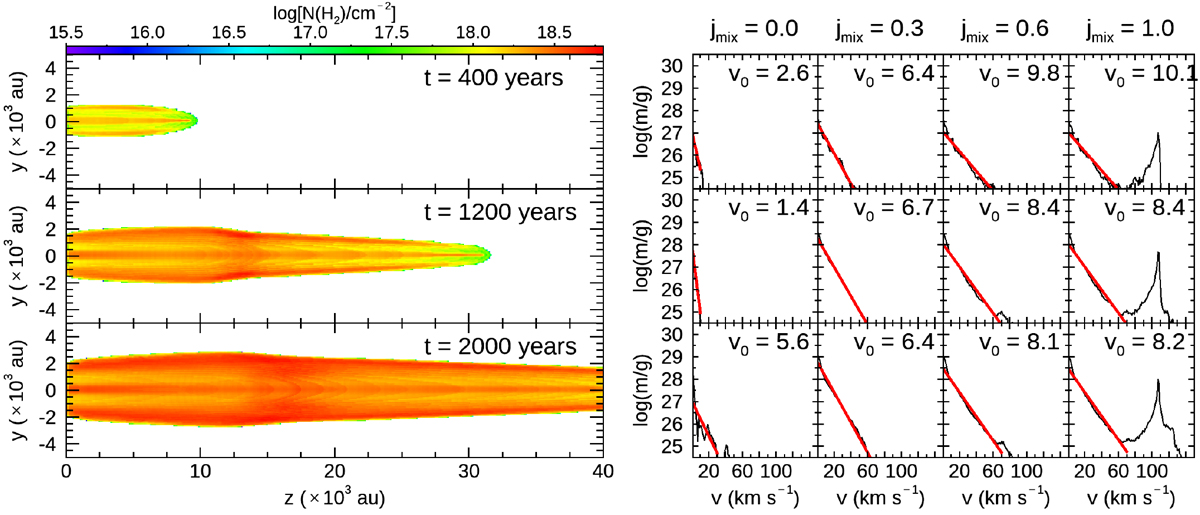
Model DR_SS at t = 400, 1200 and 2000 yr (from top to bottom) and for an inclination angle i = 30°. Left: distribution of molecular gas column density. Right: mass–velocity relationship is depicted in black for each value of the jmix parameter, from jmix = 0.0 (first column) to jmix = 1.0 (fourth column). The profiles were calculated considering the whole computational domain. The exponential best fit is drawn in red and the exponent v0 is given for each jmix value.
Current usage metrics show cumulative count of Article Views (full-text article views including HTML views, PDF and ePub downloads, according to the available data) and Abstracts Views on Vision4Press platform.
Data correspond to usage on the plateform after 2015. The current usage metrics is available 48-96 hours after online publication and is updated daily on week days.
Initial download of the metrics may take a while.