Fig. 7
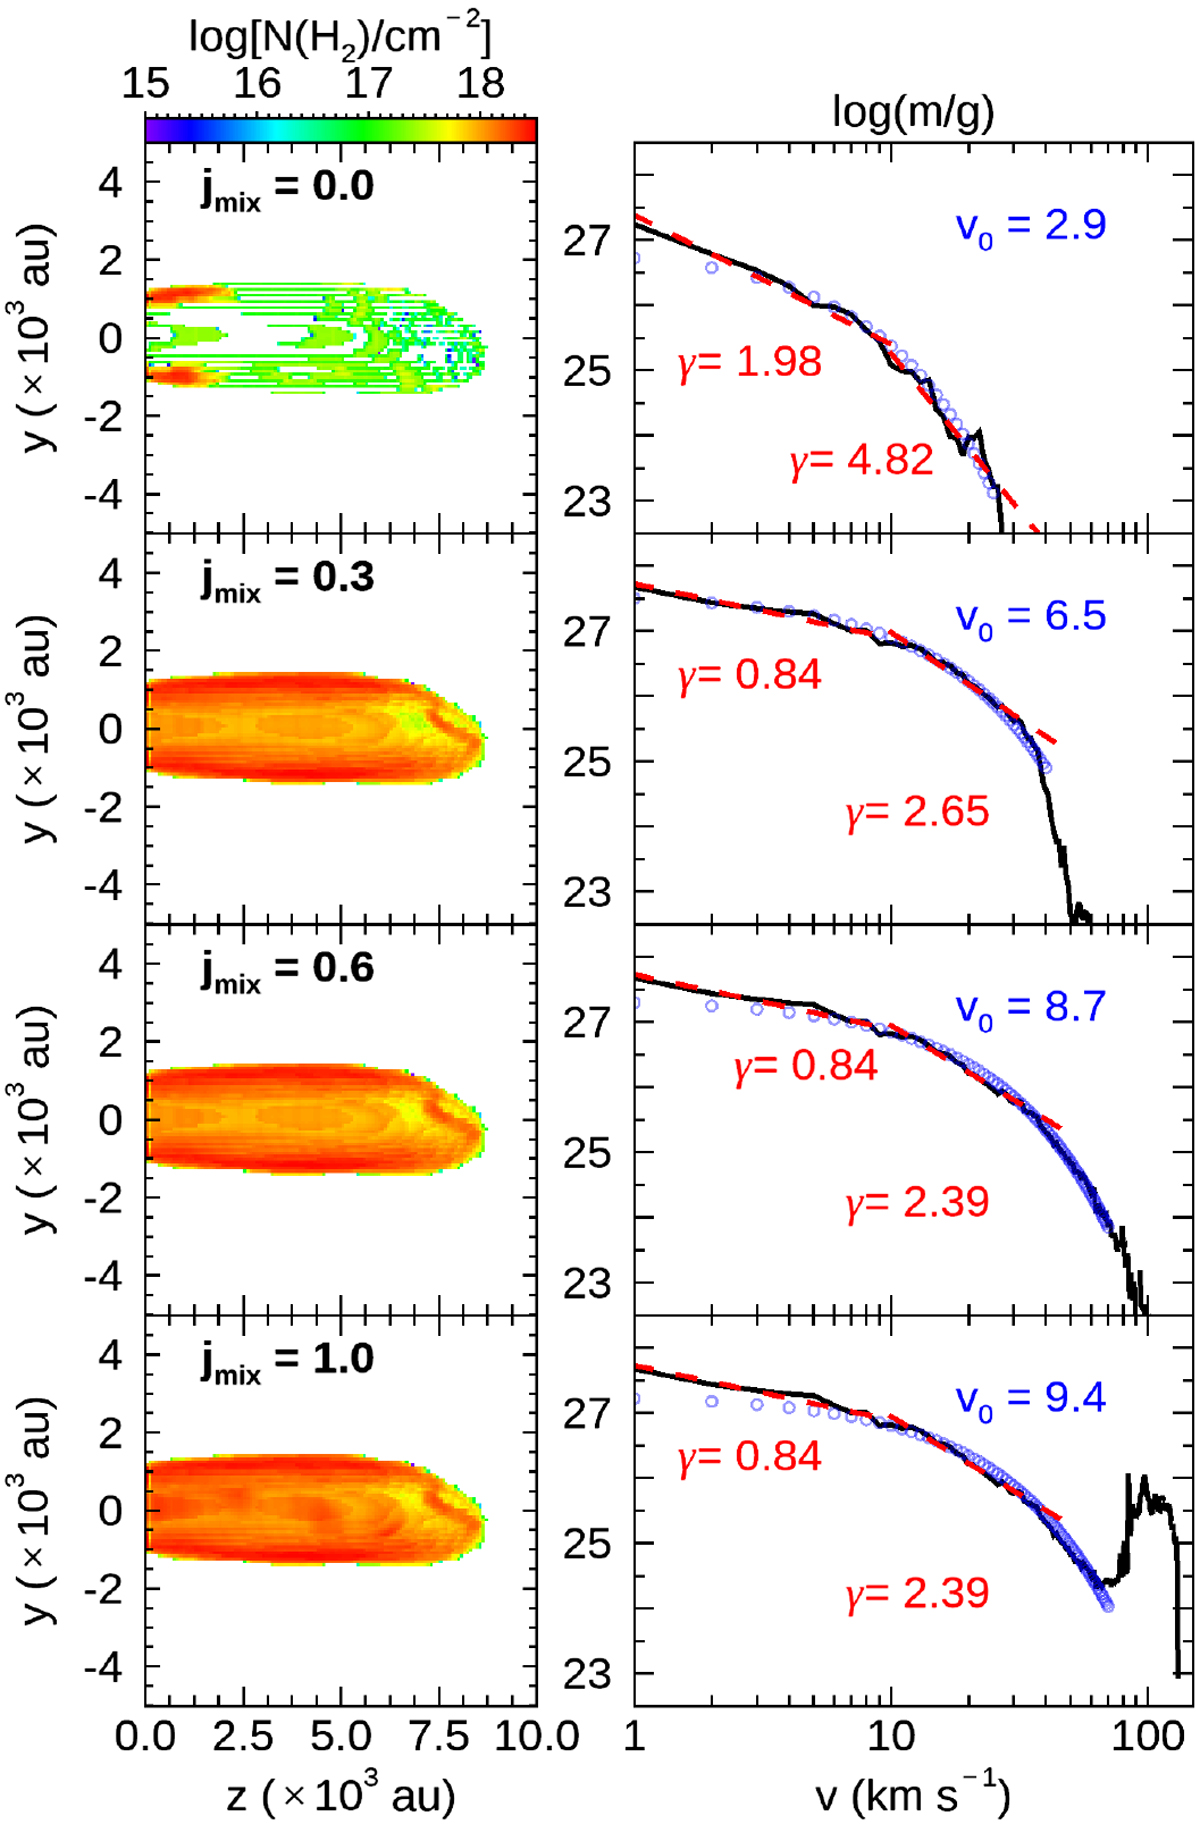
Model DR_P at t = 400 yr and an inclination angle i = 30°. Results are presented for four different values of the jet–ambient gas mixing degree jmix (from top to bottom): 0.0, 0.3, 0.6, 1.0. Left: maps of H2 column density obtained by integration over the velocity range between 1 and +150 km s−1. Right: molecular mass–velocity relationship (black). The best-fitting power laws for the two velocity intervals: v ≤10 km s−1 (left) and 10 < v ≲20 km s−1 are drawn in dashed red. The index γ is shown inside the panel. The exponential best fit is drawn in blue and the exponent v0 is given for each jmix value.
Current usage metrics show cumulative count of Article Views (full-text article views including HTML views, PDF and ePub downloads, according to the available data) and Abstracts Views on Vision4Press platform.
Data correspond to usage on the plateform after 2015. The current usage metrics is available 48-96 hours after online publication and is updated daily on week days.
Initial download of the metrics may take a while.