Fig. 4
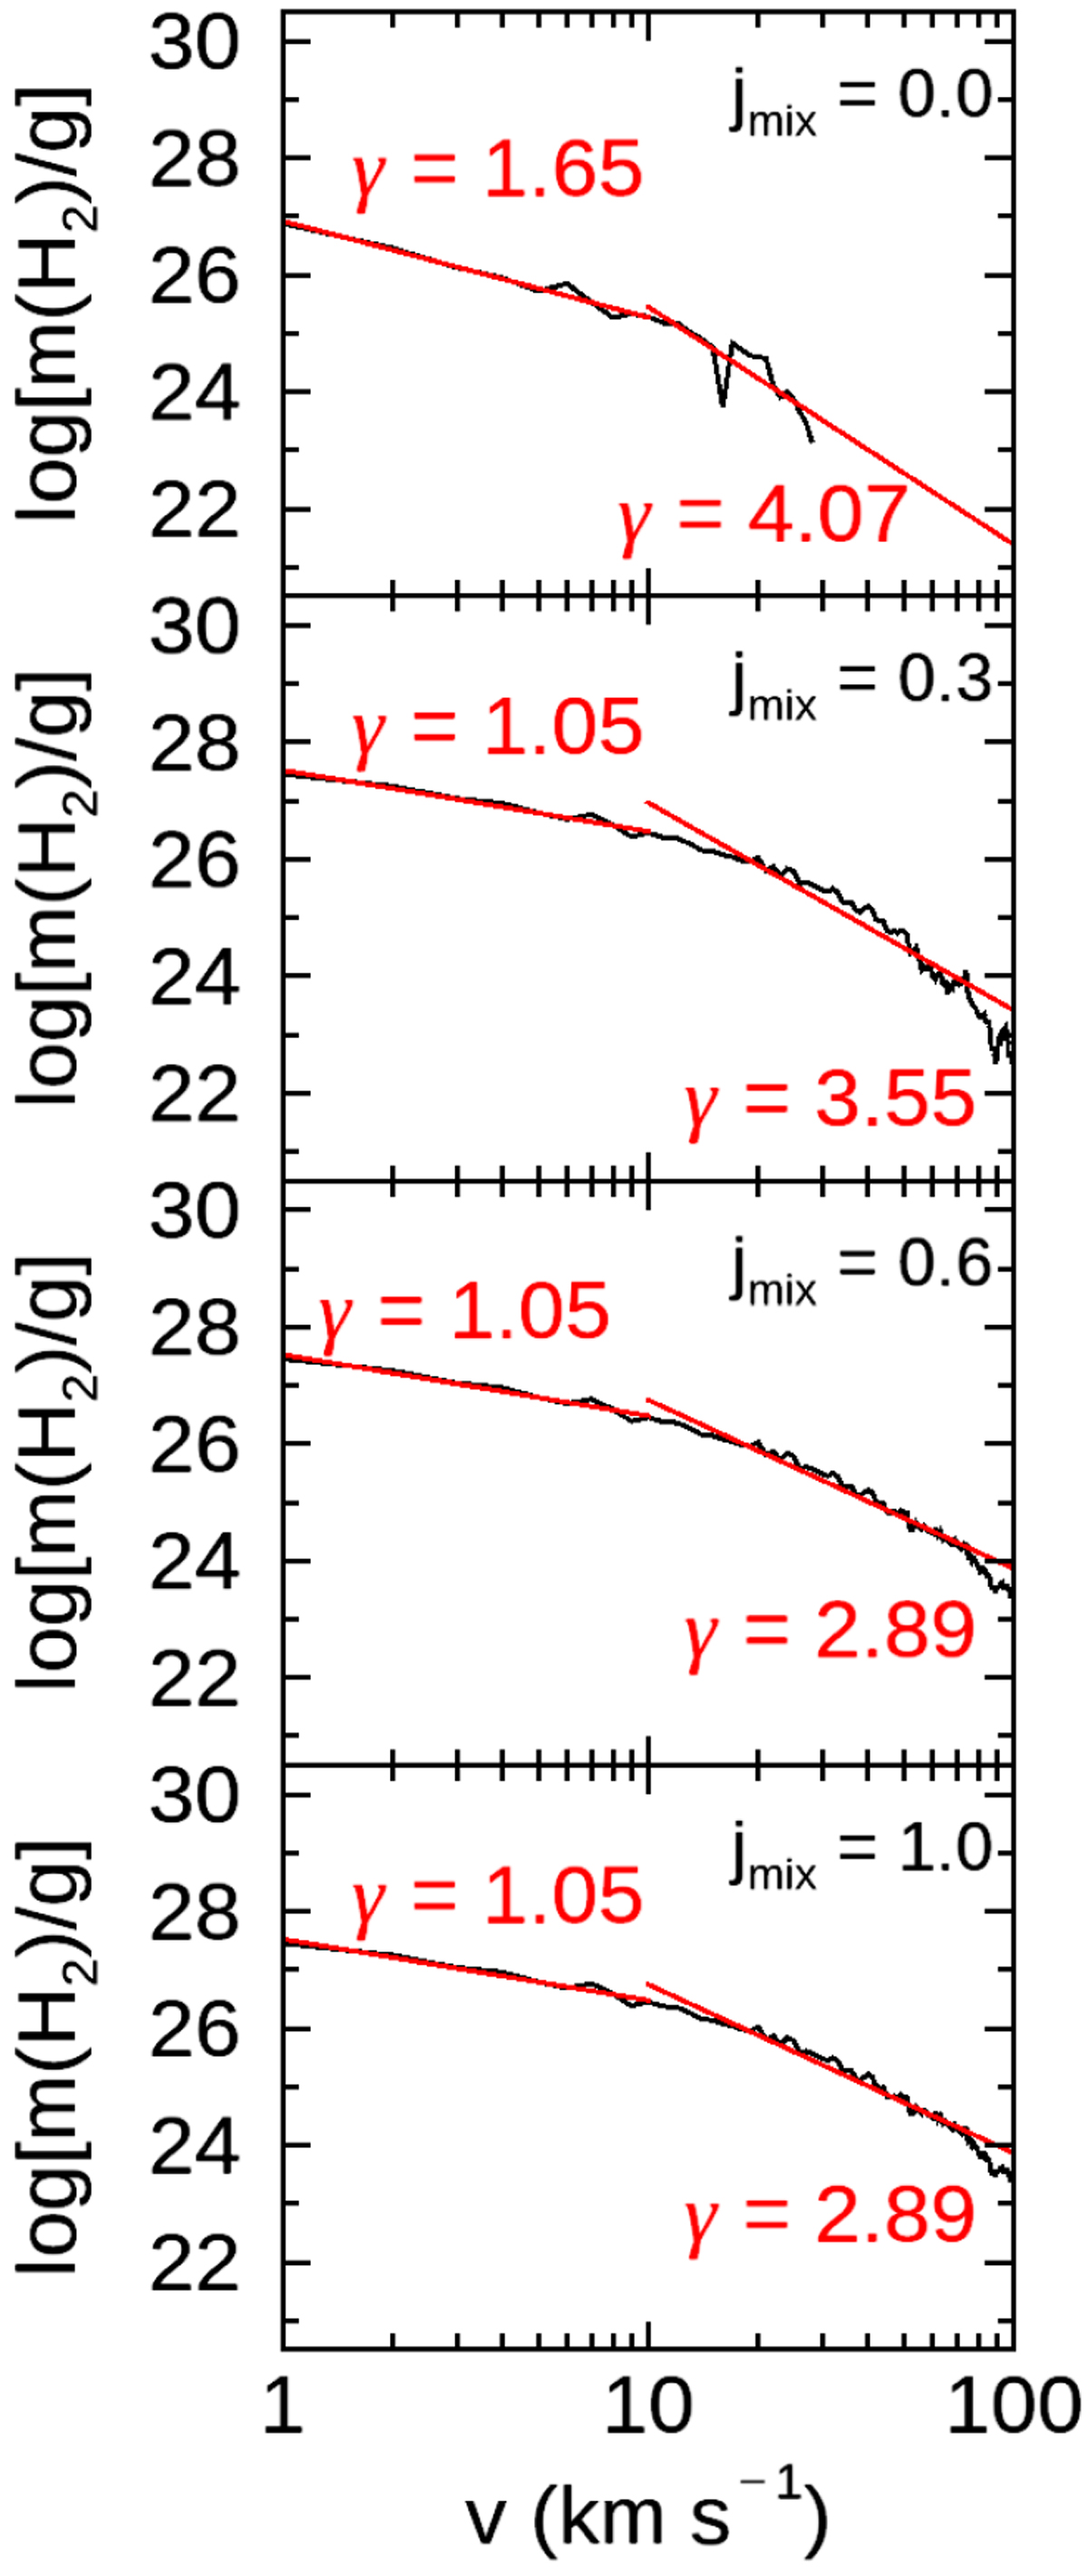
Model DR at t = 300 yr and an inclination angle of i = 60°. Molecular mass–velocity relationship ![]() (black) for the 0 km s−1 < v <100 km s−1 radial velocity range and the best-fitting power law m(v) ∝ v−γ (red). The best-fitting index value γ is shown inside each panel for two intervals: 0 km s−1 < v < 10 km s−1 (left) and 10km s−1 < v < 100 km s−1 (right). The jmix parameter is also indicated (from top to bottom, jmix = 0, 0.3, 0.6 and 1.0). The vertical axis displays the logarithm of the molecular mass (in g).
(black) for the 0 km s−1 < v <100 km s−1 radial velocity range and the best-fitting power law m(v) ∝ v−γ (red). The best-fitting index value γ is shown inside each panel for two intervals: 0 km s−1 < v < 10 km s−1 (left) and 10km s−1 < v < 100 km s−1 (right). The jmix parameter is also indicated (from top to bottom, jmix = 0, 0.3, 0.6 and 1.0). The vertical axis displays the logarithm of the molecular mass (in g).
Current usage metrics show cumulative count of Article Views (full-text article views including HTML views, PDF and ePub downloads, according to the available data) and Abstracts Views on Vision4Press platform.
Data correspond to usage on the plateform after 2015. The current usage metrics is available 48-96 hours after online publication and is updated daily on week days.
Initial download of the metrics may take a while.