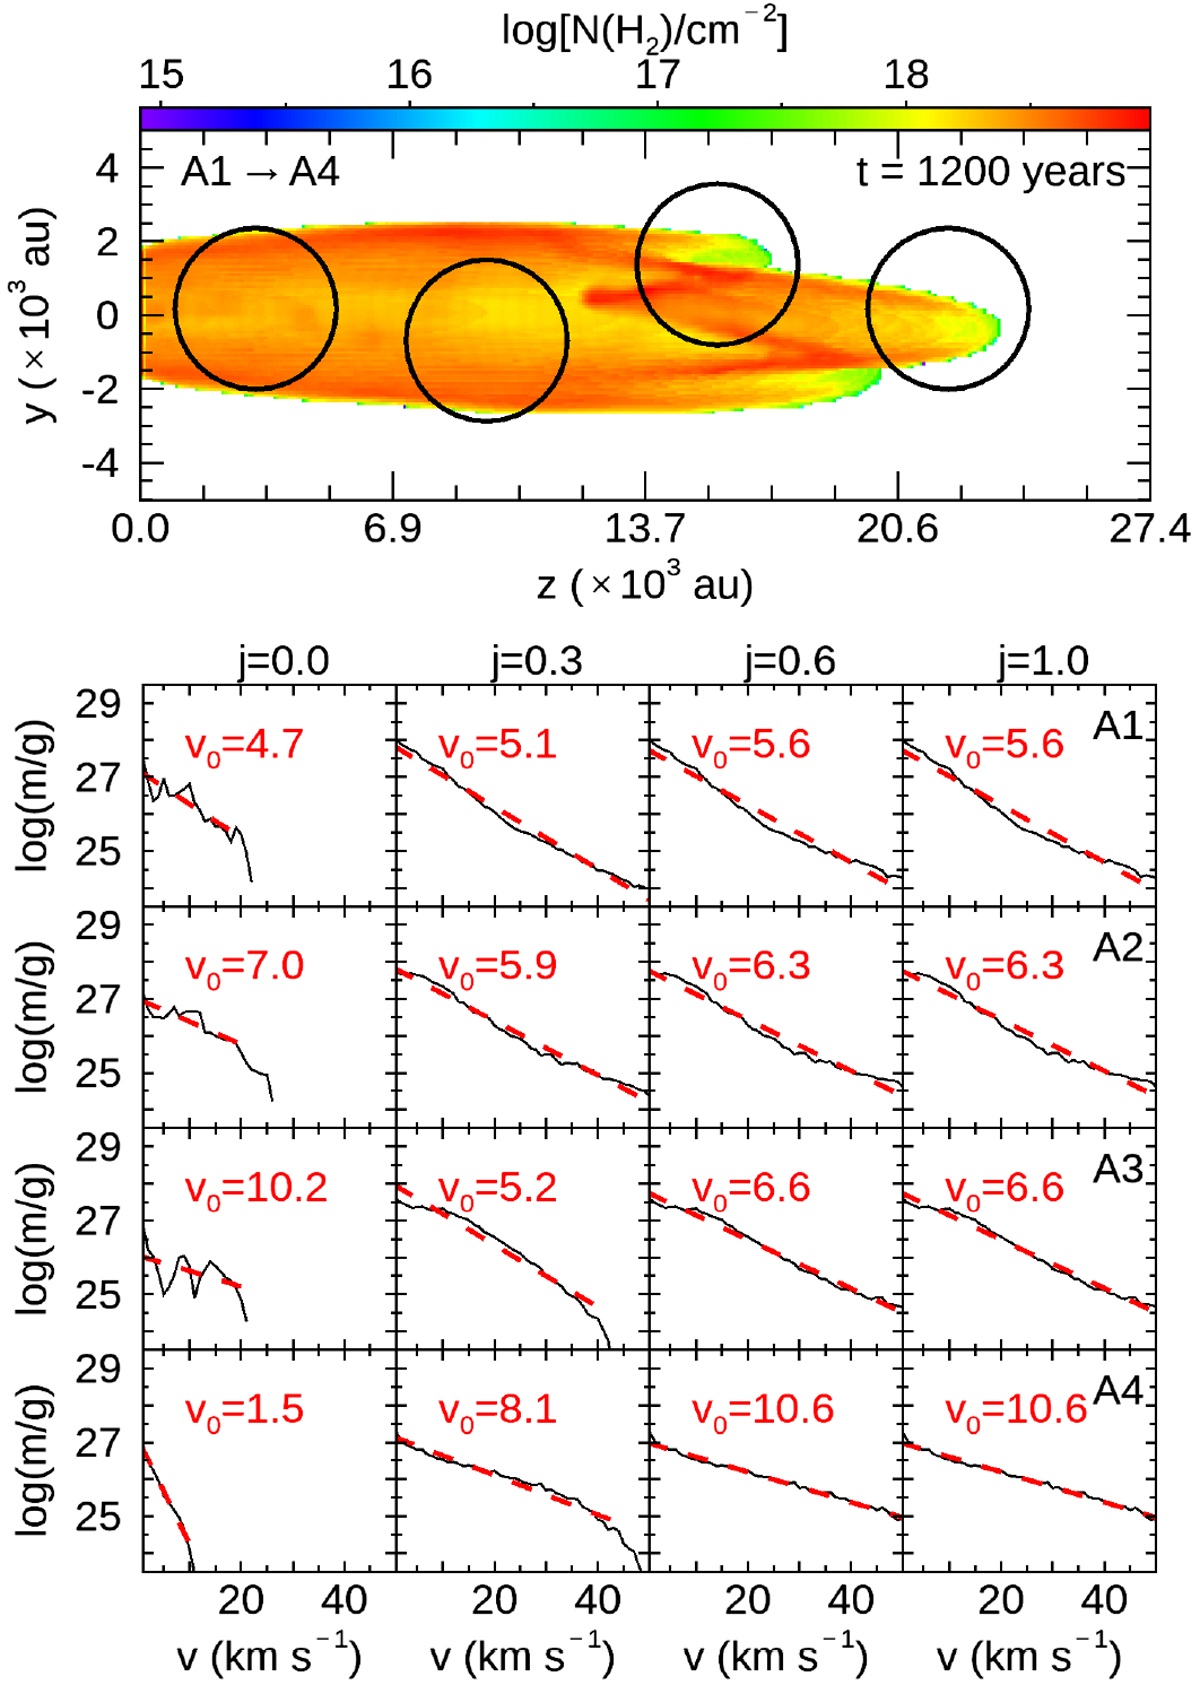
Fig. 10
Model DR_P at t = 1200 yr under an inclination of 30°. Top: map of H2 column density for jmix = 1.0. The location of the apertures A1-A4 used to extract the mass–velocity relationships are drawn with black circles. Bottom: mass–velocity relationship averaged over the circular apertures A1 to A4. The best exponential fits are drawn in dashed red. The value of v0 is given for each value of jet–ambient material mixing ratio jmix = 0, 0.3, 0.6, 1.0.
Current usage metrics show cumulative count of Article Views (full-text article views including HTML views, PDF and ePub downloads, according to the available data) and Abstracts Views on Vision4Press platform.
Data correspond to usage on the plateform after 2015. The current usage metrics is available 48-96 hours after online publication and is updated daily on week days.
Initial download of the metrics may take a while.