Fig. 3.
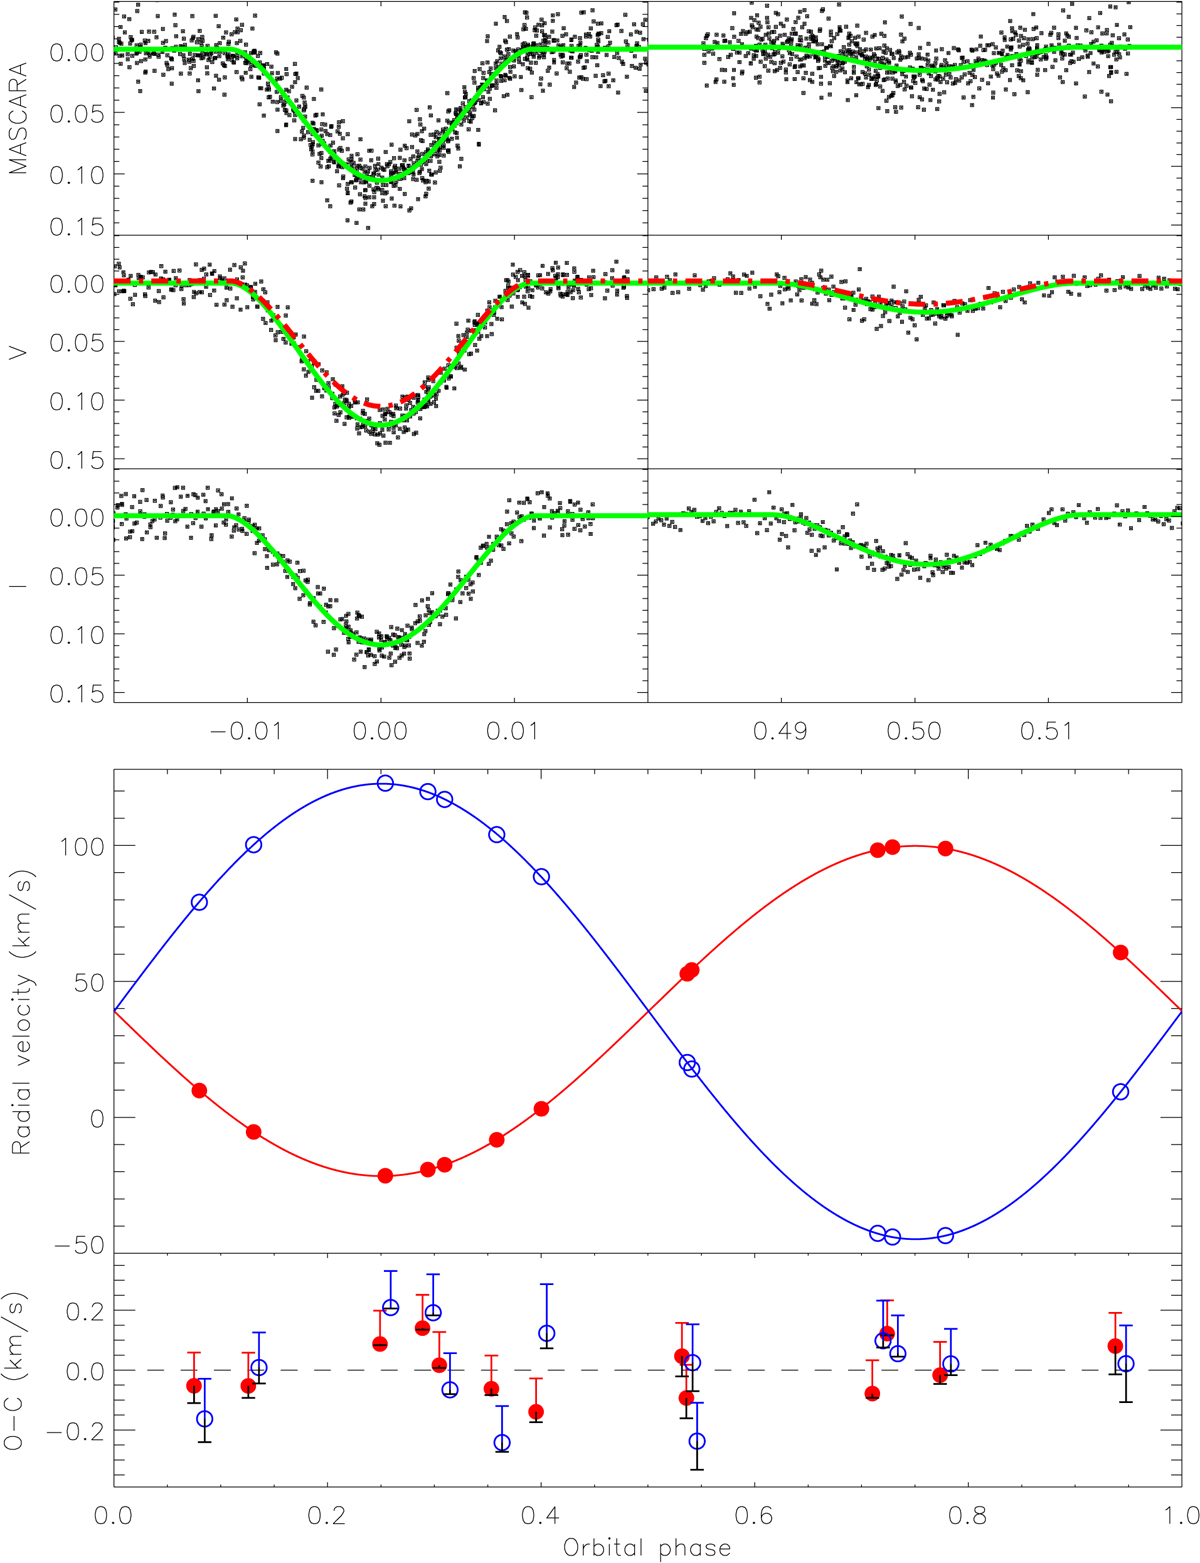
Light curves and radial velocity measurements of HD27130 compared to eclipsing binary models. Upper panels: phased light curves showing relative magnitude in MASCARA V and I filters at phases at or close to eclipse. Green lines are the best model for the given filter. In the V-band panel, the red dashed line is the best model using the MASCARA light curve. Bottom panels: radial velocity measurements of the HD 27130 components from SONG spectra. Red indicates the primary component and blue is the secondary. In the O–C panel, the measurements of the primary and secondary component are shifted by ±0.005, respectively, in phase for clarity. We note that the upwards-pointing error bar gives the measurement error, while the downwards-pointing error bar indicates the maximum difference between models based on different light curves.
Current usage metrics show cumulative count of Article Views (full-text article views including HTML views, PDF and ePub downloads, according to the available data) and Abstracts Views on Vision4Press platform.
Data correspond to usage on the plateform after 2015. The current usage metrics is available 48-96 hours after online publication and is updated daily on week days.
Initial download of the metrics may take a while.