Fig. 9.
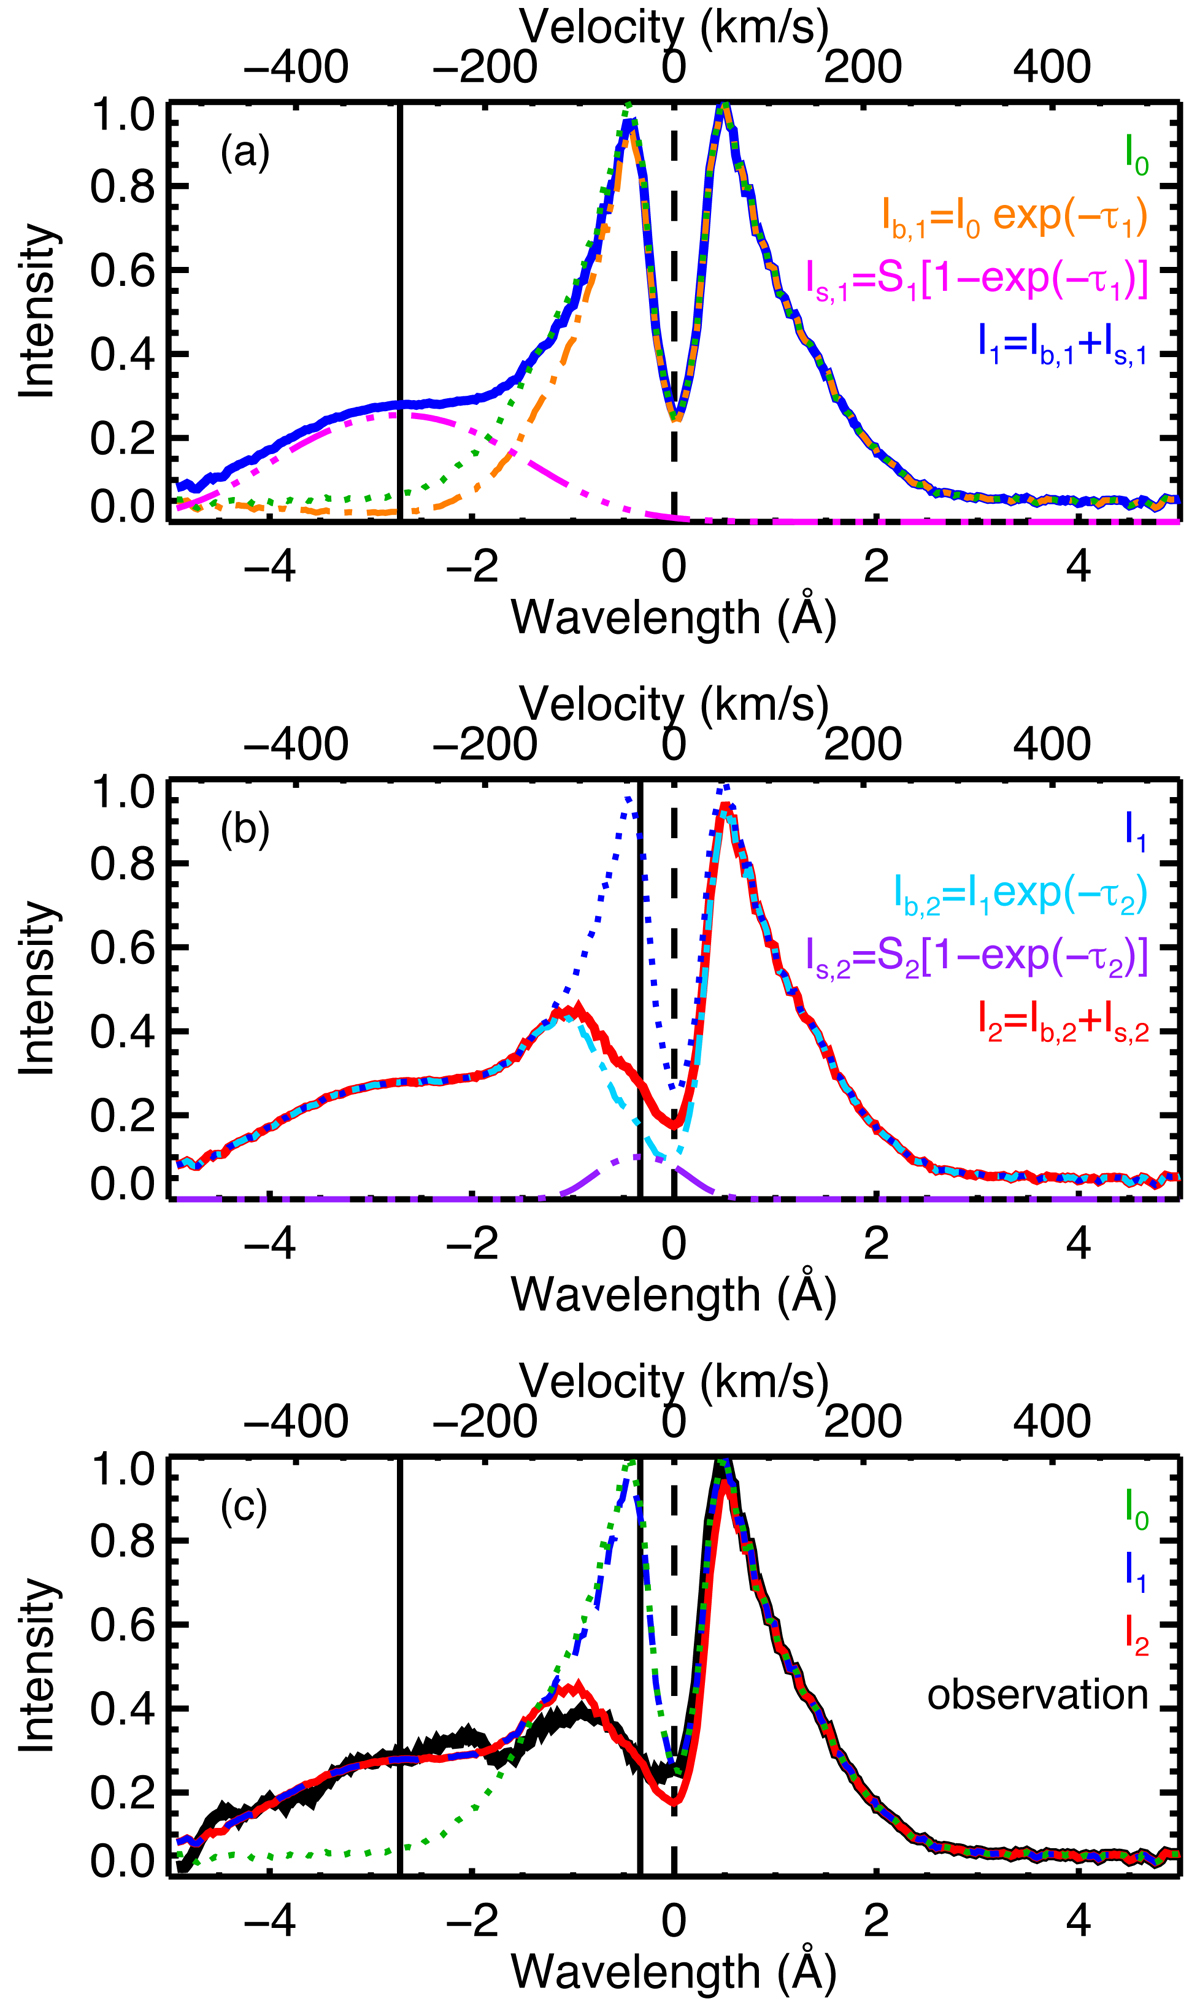
Two-cloud model calculation of the Mg II k line profile at 02:04:28 UT for pixel y = 79 (Fig. 6d). Situation in which the cloud c2 is located above the cloud c1 along the LOS is shown. (a) Detail of the I1 profile. The dotted (green) line shows I0, the background intensity profile (symmetric) made from the red side of the observed intensity profile (part of the mini-flare symmetrical profile). The dot-dashed (orange) line shows Ib, 1 ≡ I0e−τ1, the background intensity attenuated by the cloud c1. The dot-dot-dot-dashed (pink) line shows Is, 1 ≡ S1[1 − e−τ1], the emission from the cloud c1. The solid (blue) line shows I1 = Ib, 1 + Is, 1, the resulting intensity profile when only the background atmosphere and the cloud c1 are along the LOS. (b) Detail of the I2 profile. The dotted (blue) line shows I1, the intensity from the background and cloud c1 (as “background” intensity profile for cloud c2). The dot-dashed (light blue) line shows Ib, 2 ≡ I1e−τ2, the intensity from the background and the cloud c1 attenuated by cloud c2. The dot-dot-dot-dashed (purple) line shows Is, 2 ≡ S2[1 − e−τ2], the emission from cloud c2. The solid (red) line shows I2 = Ib, 2 + Is, 2, the resulting (modelled) intensity profile with the background atmosphere, cloud c1, and cloud c2. (c) A comparison of observed (solid, black) and modelled (solid, red) profiles. The background profile I0 (dotted, green) and the profile I1 (dashed, blue) are also shown for comparison. The vertical solid black lines in each panel show the LOS velocity values of the considered clouds.
Current usage metrics show cumulative count of Article Views (full-text article views including HTML views, PDF and ePub downloads, according to the available data) and Abstracts Views on Vision4Press platform.
Data correspond to usage on the plateform after 2015. The current usage metrics is available 48-96 hours after online publication and is updated daily on week days.
Initial download of the metrics may take a while.