Fig. 8.
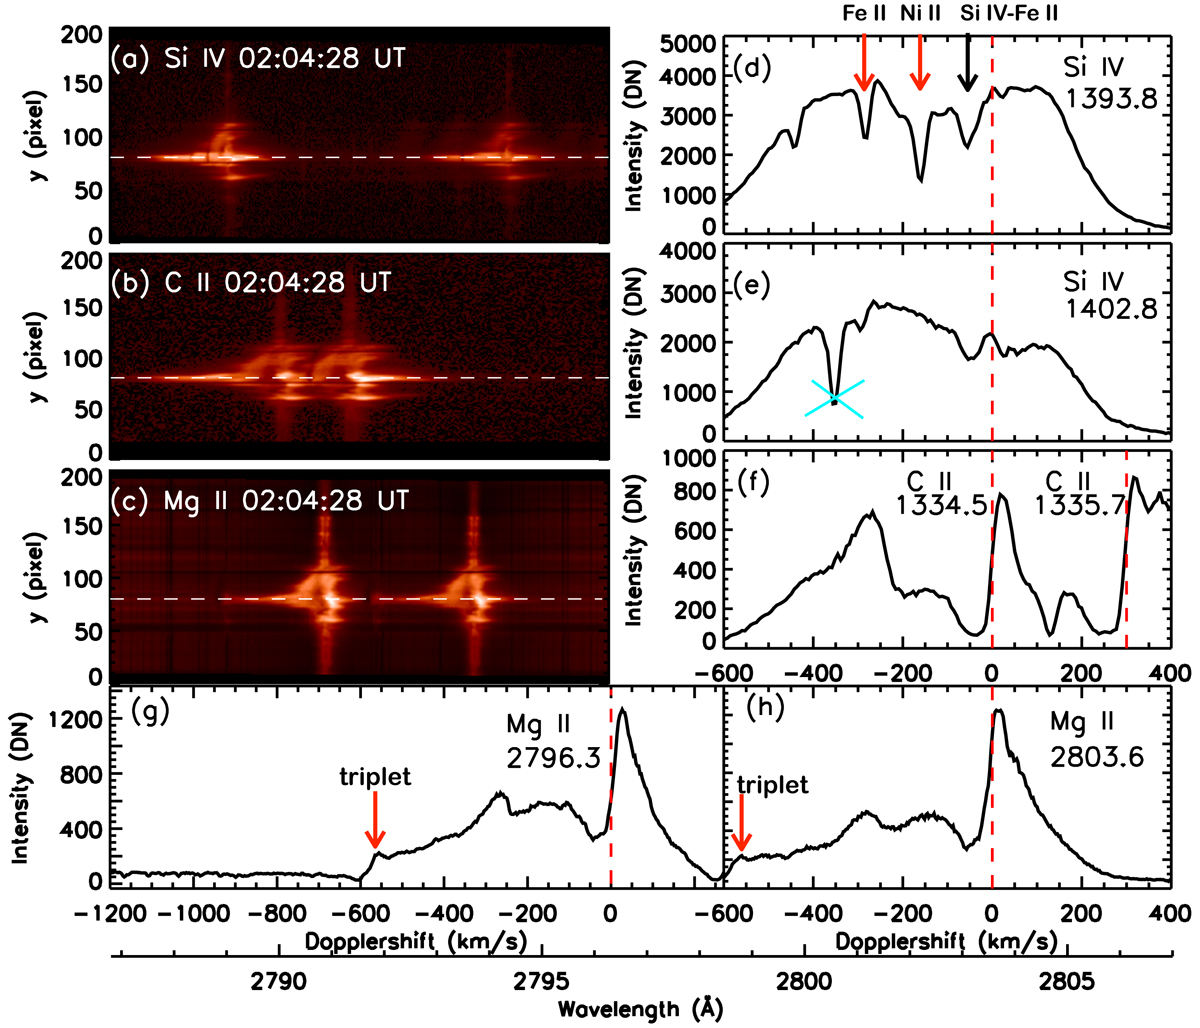
Spectra of the jet base (UV burst) showing the extended blue wing of Si IV line (panel a), C II line (panel b) and Mg II line (panel c) at 02:04:28 UT (Fig. 2 left column), the white horizontal dashed lines in these three panels indicate the position where the profiles are drawn in panels d–h. In panels d–h, the horizontal wavelength axis is shown as Dopplershift relative to the rest wavelength in each window. The Doppler-shift scale in all panels is the same for the comparison of the Doppler shifts in three element lines. We note the presence of dips in the Si IV profiles corresponding to absorption of chromospheric lines (Ni II 1393.33 Å and Fe II 1393.589 Å) indicated by red arrows in panel d. The black arrow in panel d indicates a dip due to self-absorption of Si IV line blended by a Fe II line. The cyan cross in panel e points a dip with missing data in the spectra. The dashed vertical red lines indicate the zero velocity. The red arrows in panels g–h indicate the emission of Mg II triplet lines.
Current usage metrics show cumulative count of Article Views (full-text article views including HTML views, PDF and ePub downloads, according to the available data) and Abstracts Views on Vision4Press platform.
Data correspond to usage on the plateform after 2015. The current usage metrics is available 48-96 hours after online publication and is updated daily on week days.
Initial download of the metrics may take a while.