Fig. 7.
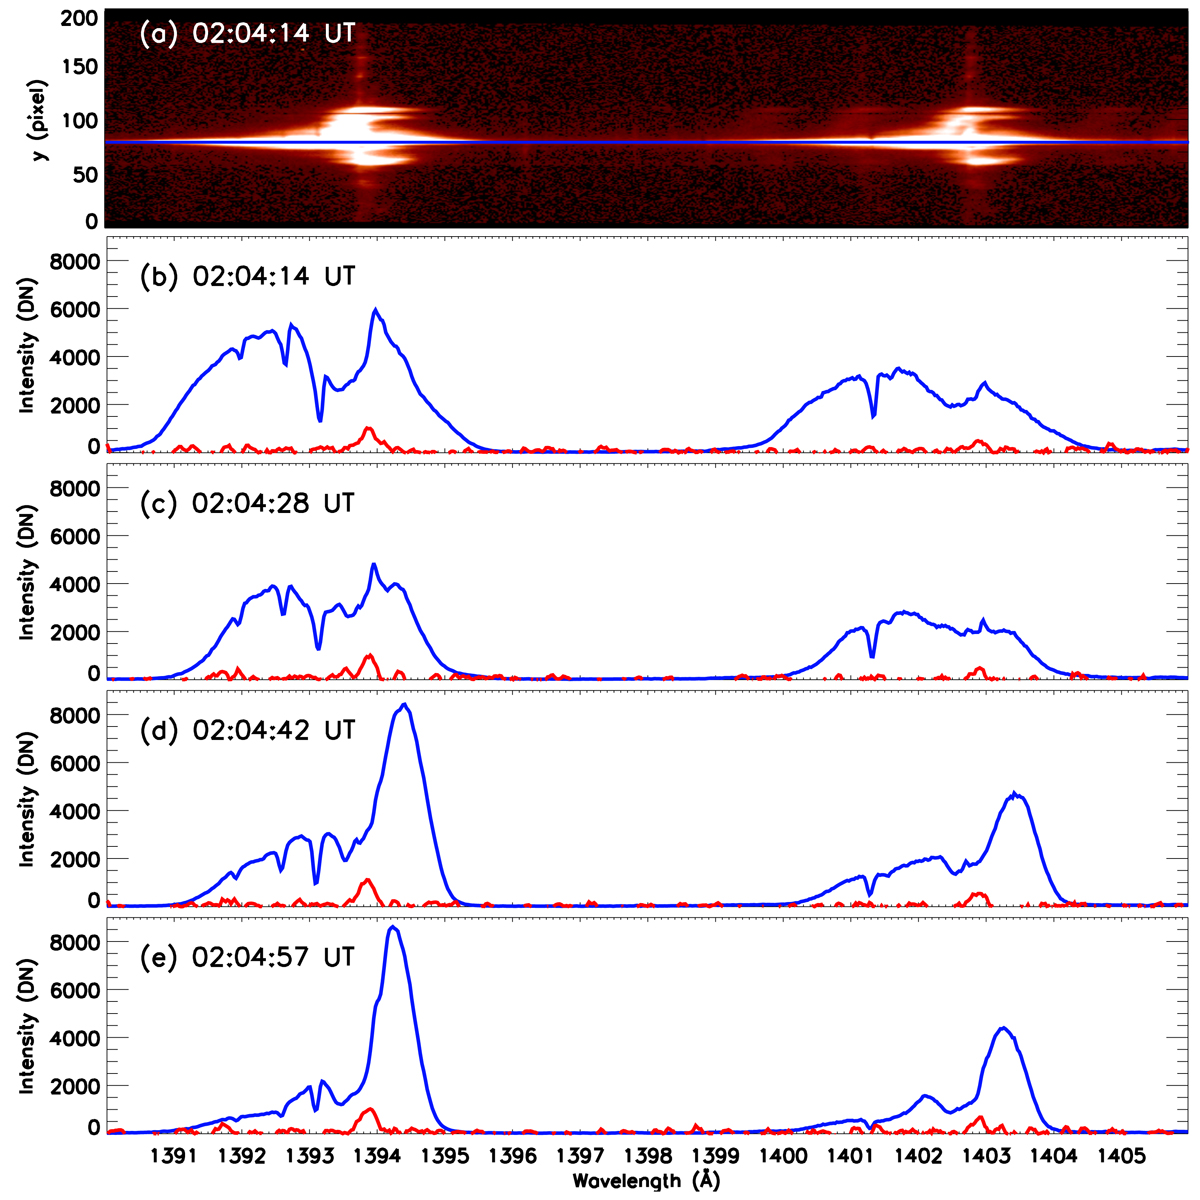
Panel a: Si IV spectra at 02:04:14 UT at the start of the UV burst (Fig. 3a). Panels b–e from top to bottom: fast evolution during less than one minute, one Si IV profile every 14 s at slit position 1 between 02:04:14 UT and 02:04:57 UT. The profiles from panels b–e are taken at y(pixel) = 79, shown as blue horizontal line in panel a. The reference profiles are shown in red.
Current usage metrics show cumulative count of Article Views (full-text article views including HTML views, PDF and ePub downloads, according to the available data) and Abstracts Views on Vision4Press platform.
Data correspond to usage on the plateform after 2015. The current usage metrics is available 48-96 hours after online publication and is updated daily on week days.
Initial download of the metrics may take a while.