Fig. 6.
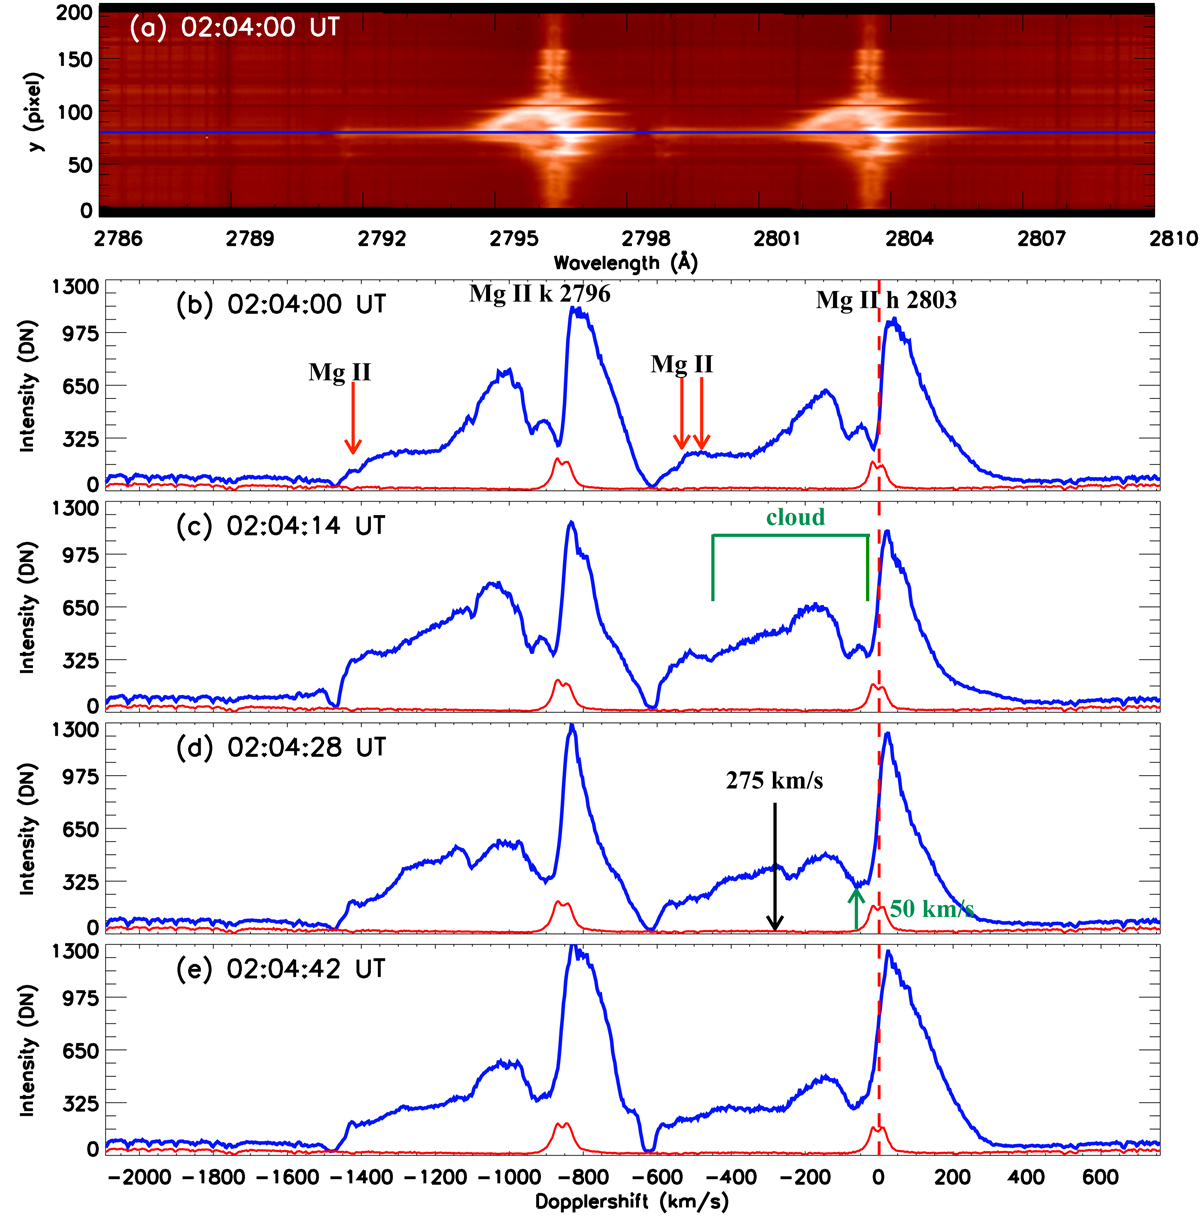
Panel a: Mg II spectra at 02:04:00 UT along the slit position 1 before the UV burst (Fig. 3g). Panels b–e from top to bottom: evolution of the Mg II k and h line profiles (for y = 79 pixel in panel a) shown by a profile every 14 s during less than one minute time (02:04:00–02:04:57 UT) (Fig. 3 h). The emission of the Mg II triplet line profiles, one at 2791.6 Å and other two at 2799 Å, are indicated by red arrows in panel b. The horizontal green brace denotes the low-intensity value of the Mg II blue peak, a signature of the possible presence of an absorbing (red arrow in panel d) and emitting radiation cloud (black arrow in panel d) along the LOS. The reference profiles are shown in red. The vertical red dashed lines in panels b–e show the position of rest wavelength at 2803.6 Å. The wavelength range in panels a and b–e is same in wavelength unit for panel a and the corresponding Doppler shift unit in panel e.
Current usage metrics show cumulative count of Article Views (full-text article views including HTML views, PDF and ePub downloads, according to the available data) and Abstracts Views on Vision4Press platform.
Data correspond to usage on the plateform after 2015. The current usage metrics is available 48-96 hours after online publication and is updated daily on week days.
Initial download of the metrics may take a while.