Fig. 5.
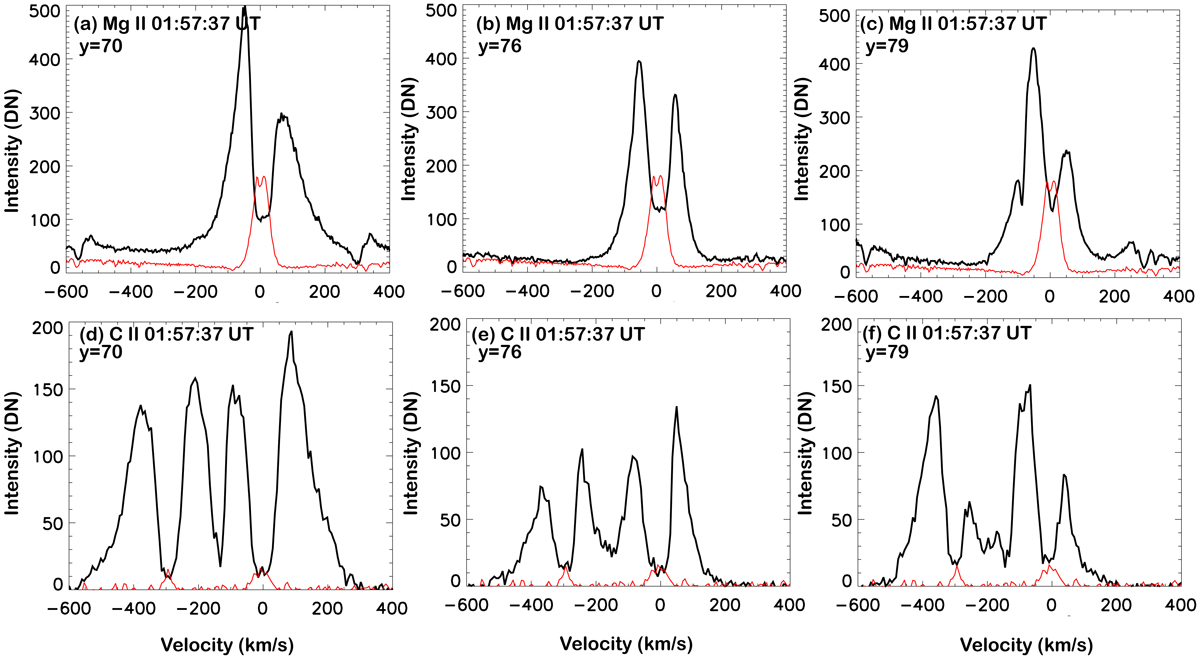
Comparison of the profiles of Mg II k (top row) and the two C II (bottom row) lines in three pixels along the slit at the position of the UV burst at 01:57:37 UT before the burst (Fig. 3f). The x-axis unit is velocity to compare the shift of the peaks of the Mg II and C II lines. The same large distance between the two peaks of the Mg II and C II lines, which could be due to the presence of cool material in the region of the reconnection before the reconnection, is represented. The red profiles are reference profiles, which were used to determine the rest wavelengths.
Current usage metrics show cumulative count of Article Views (full-text article views including HTML views, PDF and ePub downloads, according to the available data) and Abstracts Views on Vision4Press platform.
Data correspond to usage on the plateform after 2015. The current usage metrics is available 48-96 hours after online publication and is updated daily on week days.
Initial download of the metrics may take a while.