Fig. 3.
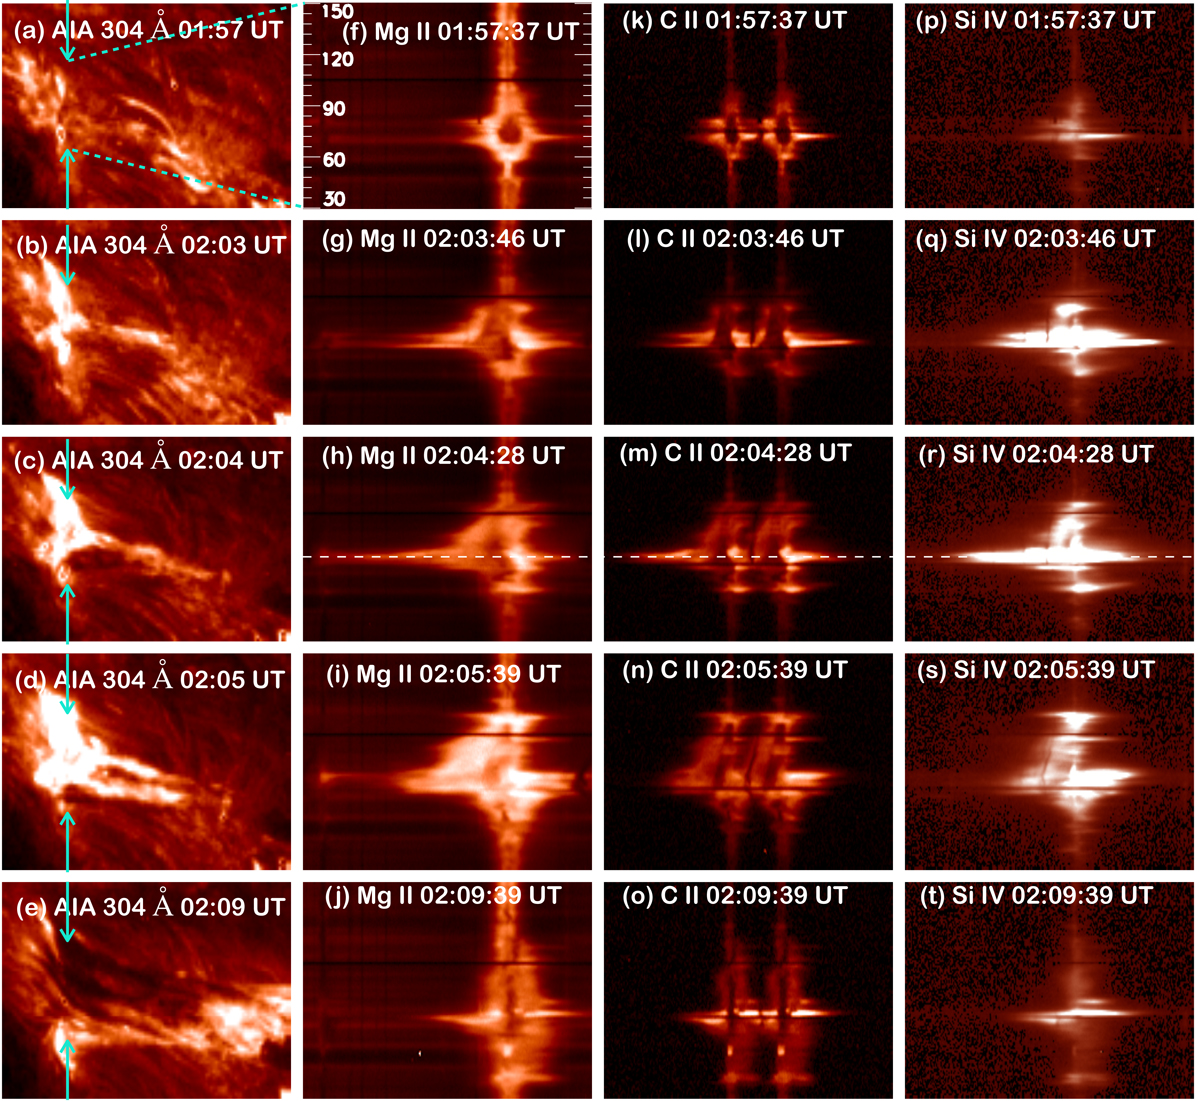
Jet reconnection base (UV burst or mini-flare) and jet evolution between 01:57 UT to 02:09 UT (from top to bottom). First column: images in AIA 304 Å. Second, third, and last columns: IRIS spectra of the jet reconnection site (UV burst) at slit 1 in the Mg II k 2796.35 Å line, C II doublet, and Si IV 1393.76 Å, respectively. The vertical cyan arrows and inclined dashed lines (panel a) in the first column indicate the position of the slit and the length of the spectra in the three other columns (30 < y(pixel) < 150). The white dashed line in panels h, m, and r shows the location for the profiles at y = 79 pixel, presented in Fig. 4.
Current usage metrics show cumulative count of Article Views (full-text article views including HTML views, PDF and ePub downloads, according to the available data) and Abstracts Views on Vision4Press platform.
Data correspond to usage on the plateform after 2015. The current usage metrics is available 48-96 hours after online publication and is updated daily on week days.
Initial download of the metrics may take a while.