Fig. 2.
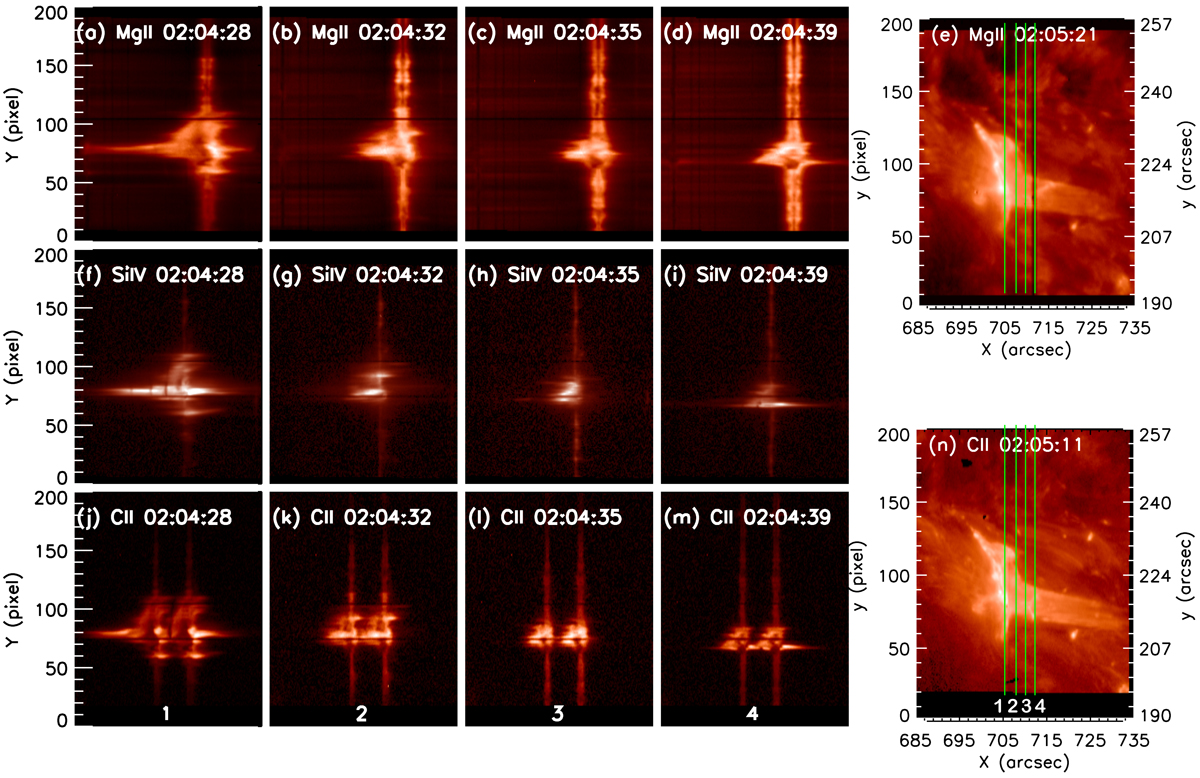
Left columns 1–4: IRIS spectra of the Mg II k line at 2796.35 Å (a–d), Si IV 1402.77 Å line (f–i), and C II 1330 Å line (j–m) at the four slit positions of raster 89. From left to right: slit positions 1, 2, 3, 4 correspond to spectra 356, 357, 358, 359. The spectra in slit position 1 (column 1) corresponds to the region of the mini-flare at the reconnection site. Right column: SJI 2796 (panel e) and SJI 1330 (panel n) with four green solid vertical lines indicating the four slit positions of the raster. The y-axis unit in the SJIs (e and n) is labelled in pixels on the left and arcsec on the right to show the correspondence between spectra and SJIs.
Current usage metrics show cumulative count of Article Views (full-text article views including HTML views, PDF and ePub downloads, according to the available data) and Abstracts Views on Vision4Press platform.
Data correspond to usage on the plateform after 2015. The current usage metrics is available 48-96 hours after online publication and is updated daily on week days.
Initial download of the metrics may take a while.