Fig. 15.
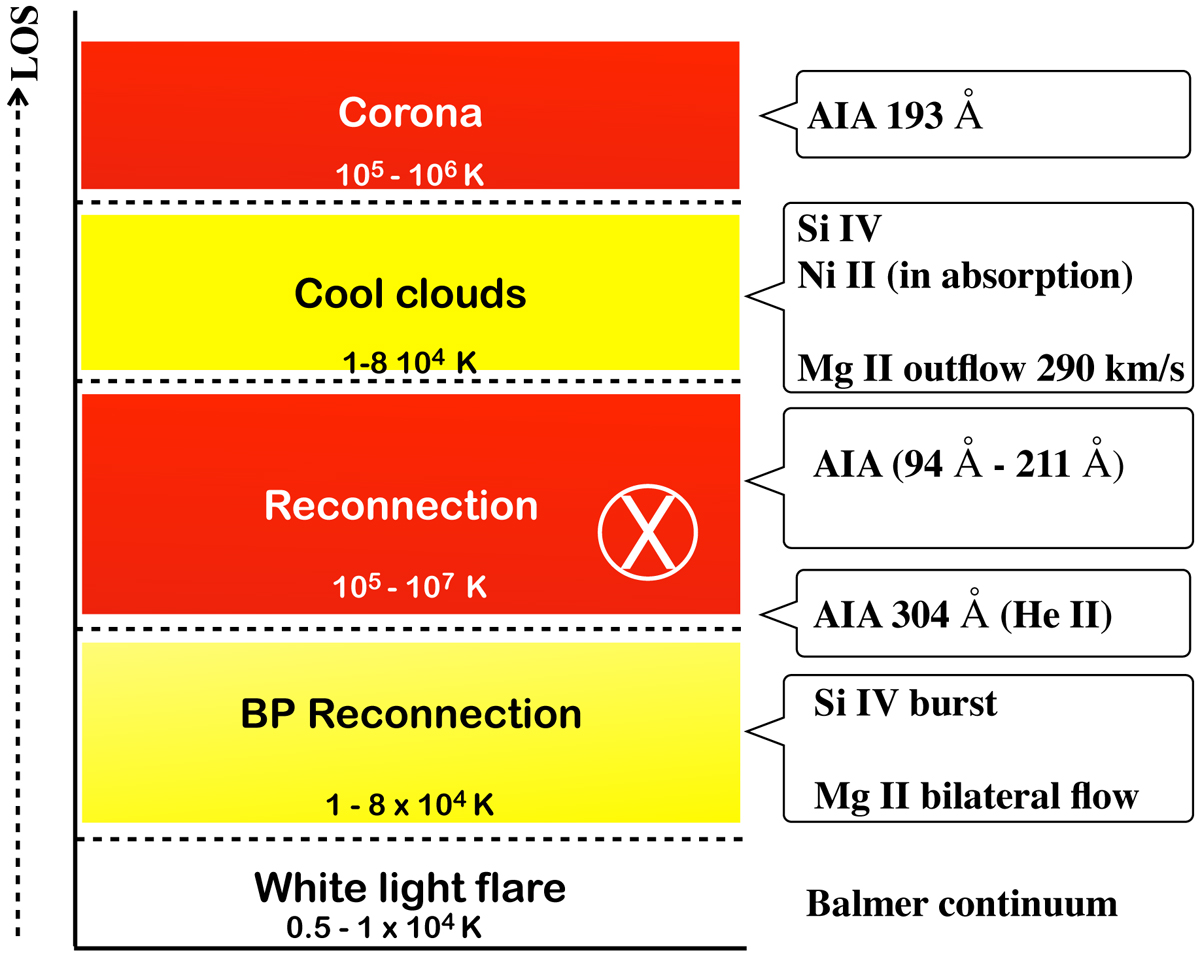
Model of multi-layers of the mini-flare atmosphere during the jet reconnection in a BP region. The model is based on the observations of emission or absorption of the IRIS lines and continua, and the images of AIA in the multi-temperature filters in the mini-flare (UV burst) around 02:04:28 UT ± 60 s (right column). The y-axis is along the LOS. The LOS successively crosses cool and hot layers (white for minimum of temperature, yellow for chromosphere until transition region temperatures, red for coronal temperatures).
Current usage metrics show cumulative count of Article Views (full-text article views including HTML views, PDF and ePub downloads, according to the available data) and Abstracts Views on Vision4Press platform.
Data correspond to usage on the plateform after 2015. The current usage metrics is available 48-96 hours after online publication and is updated daily on week days.
Initial download of the metrics may take a while.