Fig. 14.
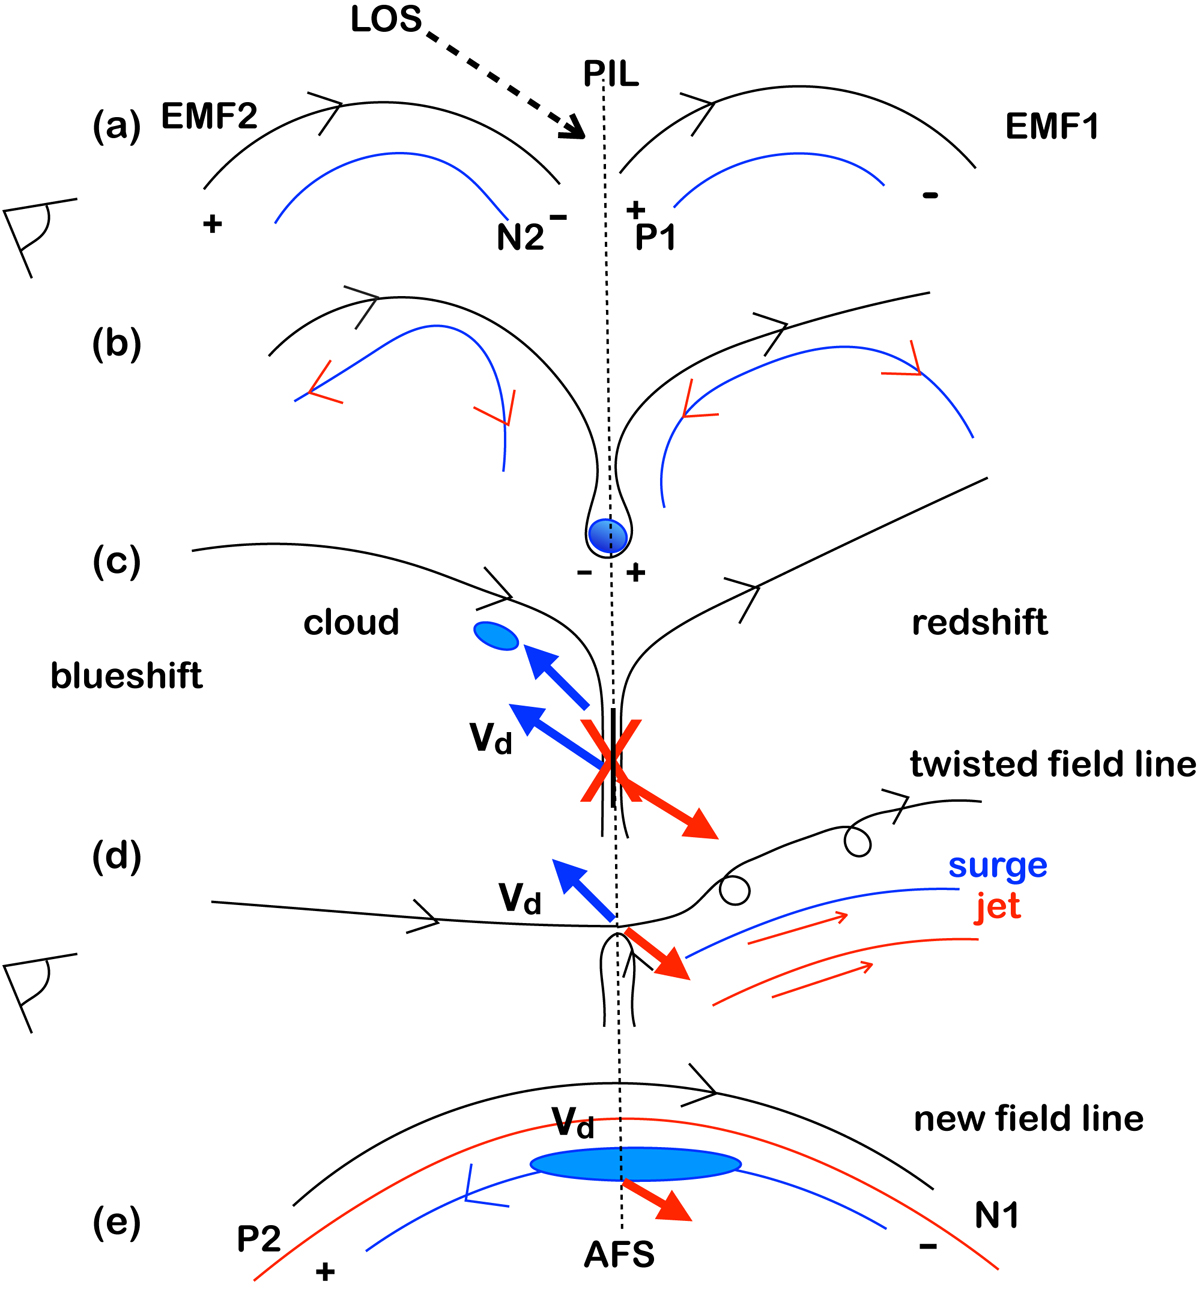
Sketch of the dynamics of the plasma in 2D (x, z) plane at the reconnection site before (panels a and b), during (panels c and d), and after the magnetic reconnection (panel e). The sketch is based on the characteristics of the spectra detailed in Table 4. Panel a: time 01:51 UT, panel b: 01:59 UT, panel c: between 02:02:21 and 02:04:28 UT, panel d: 02:05:39 UT, and panel e: 02:10 UT. The eye on the left side indicates that the observations are done on the side because the AR is located at W 60. The projected LOS in the plane (x, z) is also shown by dashed arrow at the top. The magnetic field lines are shown with black solid lines with arrows. The vertical central dotted line is the PIL between magnetic polarities N2 and P1. The red solid lines indicate the hot jet (in panel d) or loops (in panel e) and the velocity directions are indicated by thin blue/red arrows for the transverse flow (panels b and e) and thick arrows for blue/redshifts (Vd) estimated at the PIL zone (panels c–e). In panel a EMF1 and EMF2 represent two EMFs, and N2-P1 is the bipole where the reconnection occurs in a BP with cool material trapped inside (blue circle in panel b). The blue lines and ovals denote the cool plasma visible with IRIS. The reconnection occurs at the “X” point with bidirectional outflows (panel c). The cloud is shown by a blue oval on the left. Nearly at the same time the jet (red line, hot plasma visible in AIA filters) and the surge (blue line) are expelled with some twist to the right (panel d). Panel e: long loops (red line) and an AFS (blue oval) between P2 and N1 after the reconnection.
Current usage metrics show cumulative count of Article Views (full-text article views including HTML views, PDF and ePub downloads, according to the available data) and Abstracts Views on Vision4Press platform.
Data correspond to usage on the plateform after 2015. The current usage metrics is available 48-96 hours after online publication and is updated daily on week days.
Initial download of the metrics may take a while.