Open Access
Fig. 10.
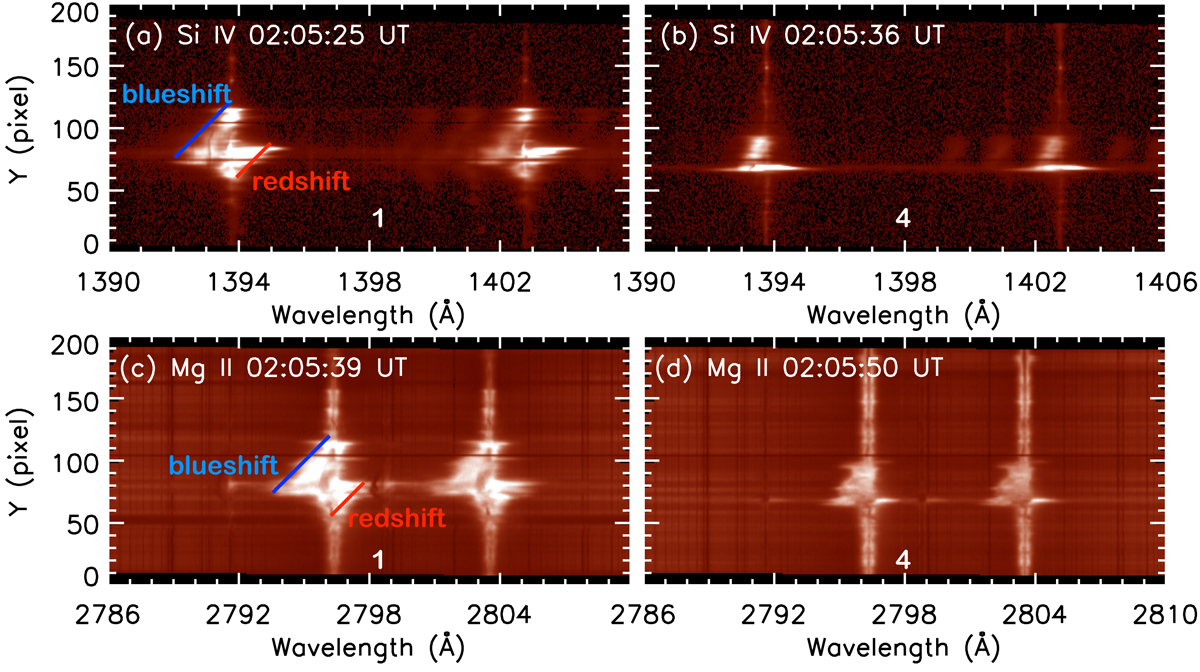
Tilt observed in the Si IV and Mg II spectra during the GOES flare time at slit positions 1 and 4, distant of 6 arcsec (panels a–b for Si IV lines, panels c–d for Mg II lines) (see Fig. 3 panels d, i, s). The blue and redshifts are shown with the solid lines in the spectra of Si and Mg at slit position 1.
Current usage metrics show cumulative count of Article Views (full-text article views including HTML views, PDF and ePub downloads, according to the available data) and Abstracts Views on Vision4Press platform.
Data correspond to usage on the plateform after 2015. The current usage metrics is available 48-96 hours after online publication and is updated daily on week days.
Initial download of the metrics may take a while.