Fig. 2.
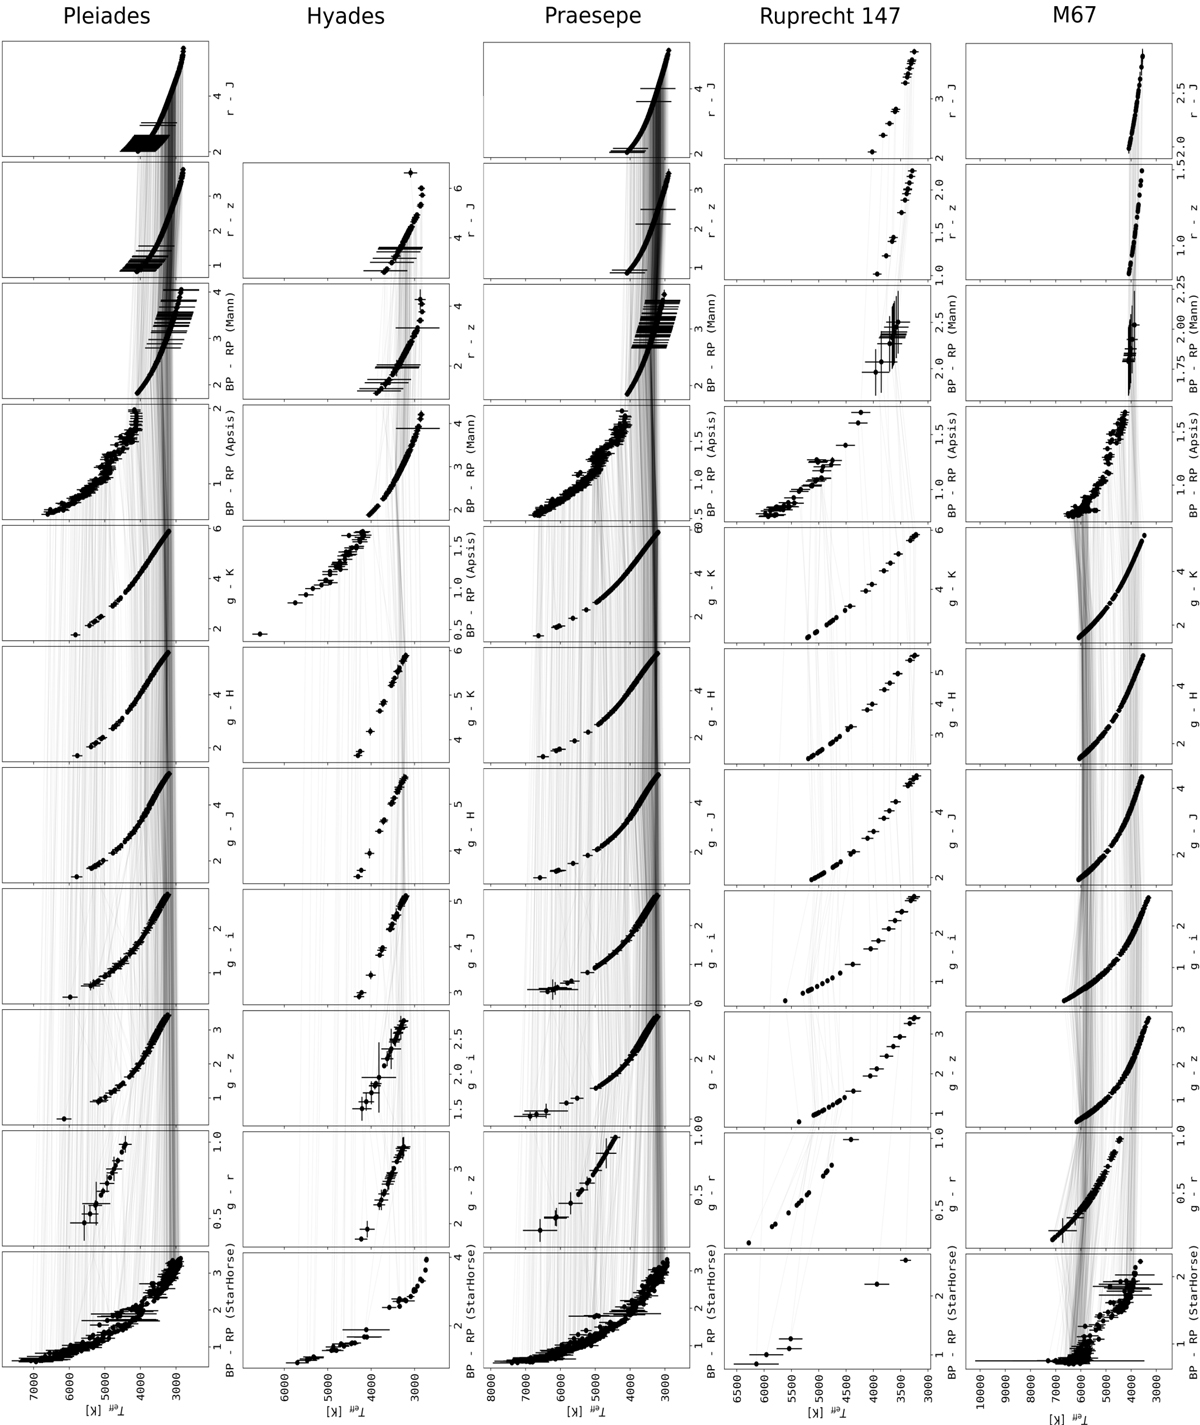
Empricial color-Teff relations applied to high probability members of the five open clusters in this study. Individual stars are connected with lines between subplots to illustrate differences in the relations. We used PanSTARRS griz, 2MASS JHK, and Gaia DR2 BP and RP photometry with the following relations: BP − RP (StarHorse, Anders et al. 2019); g − r, g − i, g − z, g − J, g − H, g − K (Boyajian et al. 2013); BP − RP (Apsis, Andrae et al. 2018); BP − RP (Mann), r − z, and r − J (Mann et al. 2016). The majority of connecting lines show very little slope, indicating that different CTRs are consistent with one another when applied to our sample. As expected, some relations show noticeable systematic differences, especially at the high and low temperature ends of their scopes of validity. We did not count results from Apsis with Teff < 4100 K because the pipeline systematically overestimated the temperatures for M dwarfs (Andrae et al. 2018; Kesseli et al. 2019).
Current usage metrics show cumulative count of Article Views (full-text article views including HTML views, PDF and ePub downloads, according to the available data) and Abstracts Views on Vision4Press platform.
Data correspond to usage on the plateform after 2015. The current usage metrics is available 48-96 hours after online publication and is updated daily on week days.
Initial download of the metrics may take a while.