Fig. A.1.
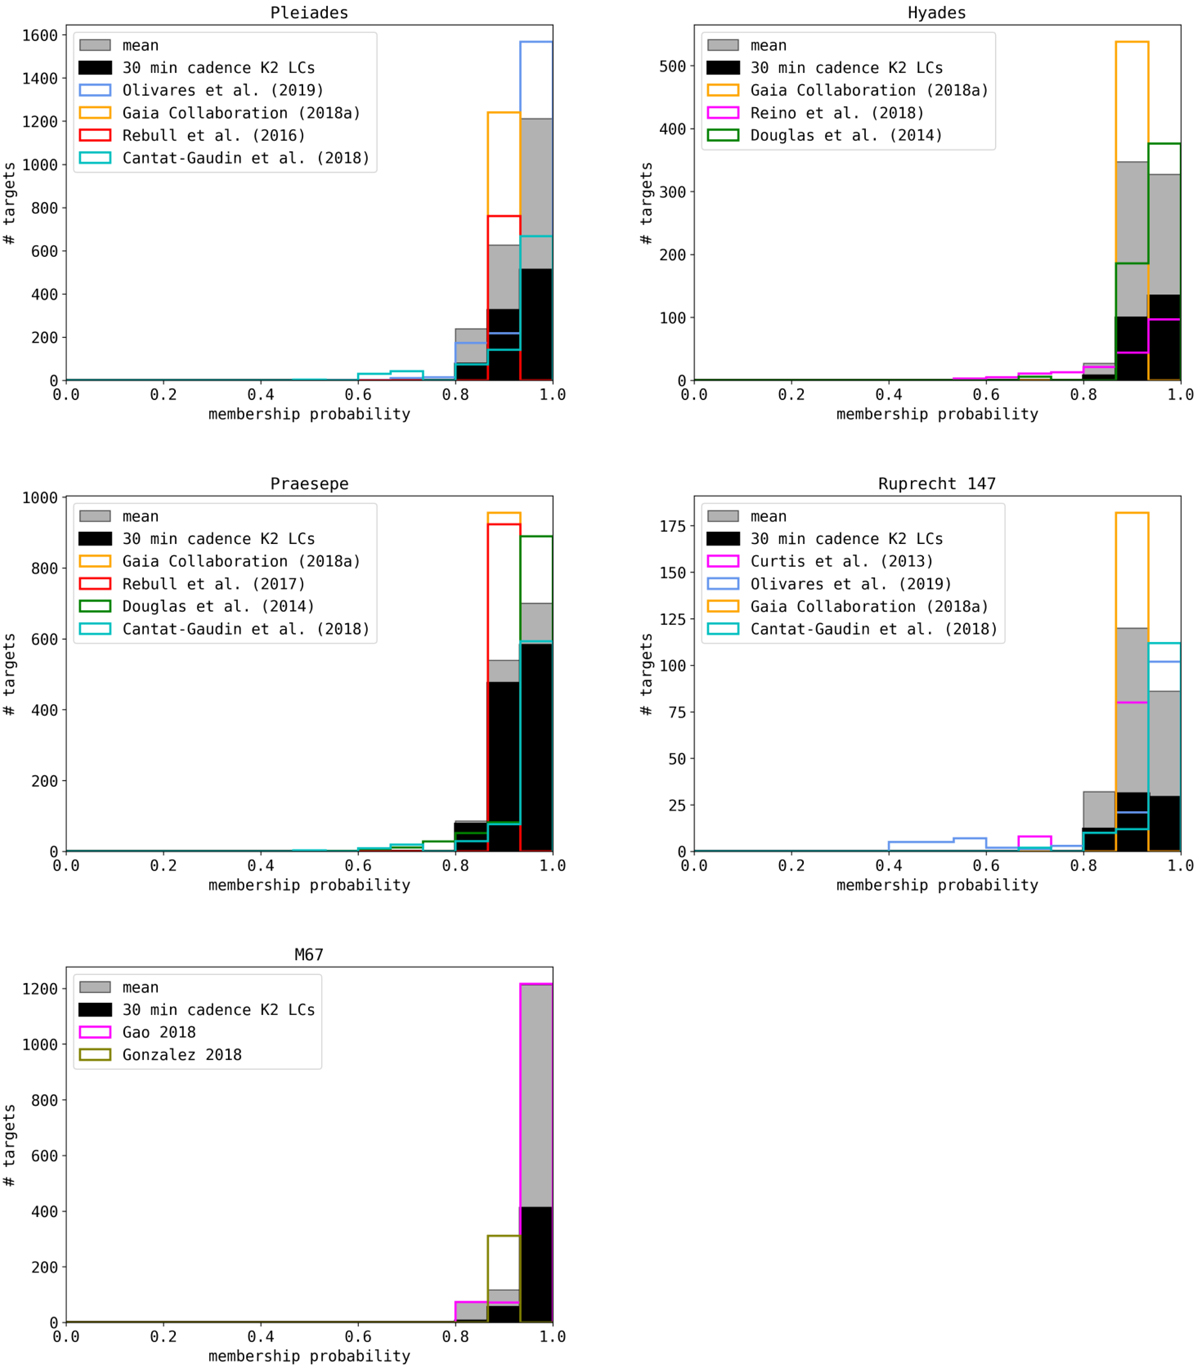
Open cluster membership histograms and selected targets. Each panel corresponds to the distribution of candidate members of the cluster indicated in the panel title. Membership catalogs are shown as step histograms (different colors). The mean membership probability distribution is a filled histogram (gray). For our study, we selected only stars with membership probabilities above 80% that were observed by K2 in long cadence mode (black filled histogram).
Current usage metrics show cumulative count of Article Views (full-text article views including HTML views, PDF and ePub downloads, according to the available data) and Abstracts Views on Vision4Press platform.
Data correspond to usage on the plateform after 2015. The current usage metrics is available 48-96 hours after online publication and is updated daily on week days.
Initial download of the metrics may take a while.