Fig. 13.
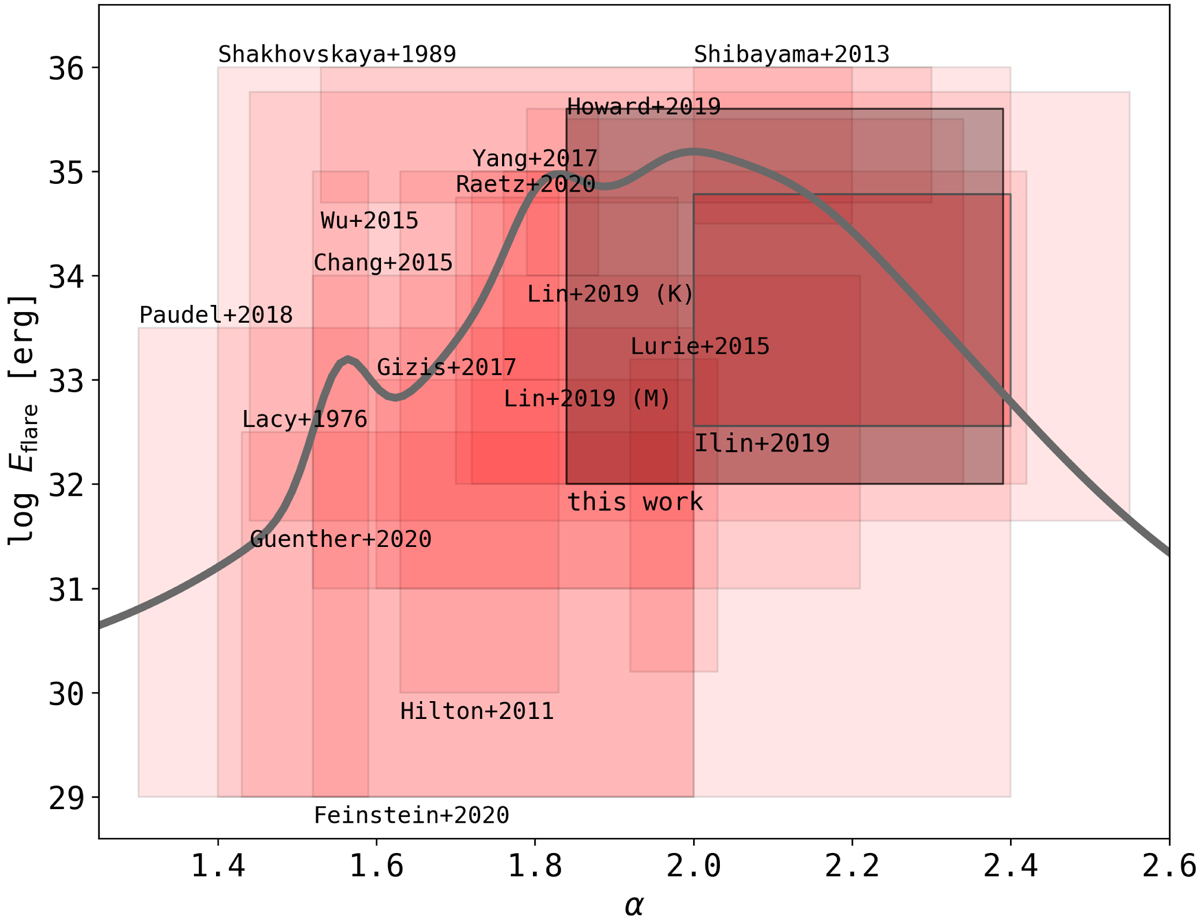
Literature overview over power law fits to FFDs. Red rectangles indicate the energy range in which flares were detected (height), and the range of values determined for the power law exponent α (width) including quoted uncertainties and superimposing the ranges for α from multiple FFDs if any. The references are anchored to the upper or lower left corner of the respective rectangle. The gray rectangle refers to this study. The gray line depicts the superposition of these results, representing each by a Gaussian fit with the range used as standard deviation, and weighted by the square root of the number of flares found in each study. Paper I is shown with a dark outline. See Sect. 5.3 for details on the quoted works.
Current usage metrics show cumulative count of Article Views (full-text article views including HTML views, PDF and ePub downloads, according to the available data) and Abstracts Views on Vision4Press platform.
Data correspond to usage on the plateform after 2015. The current usage metrics is available 48-96 hours after online publication and is updated daily on week days.
Initial download of the metrics may take a while.