Fig. 11.
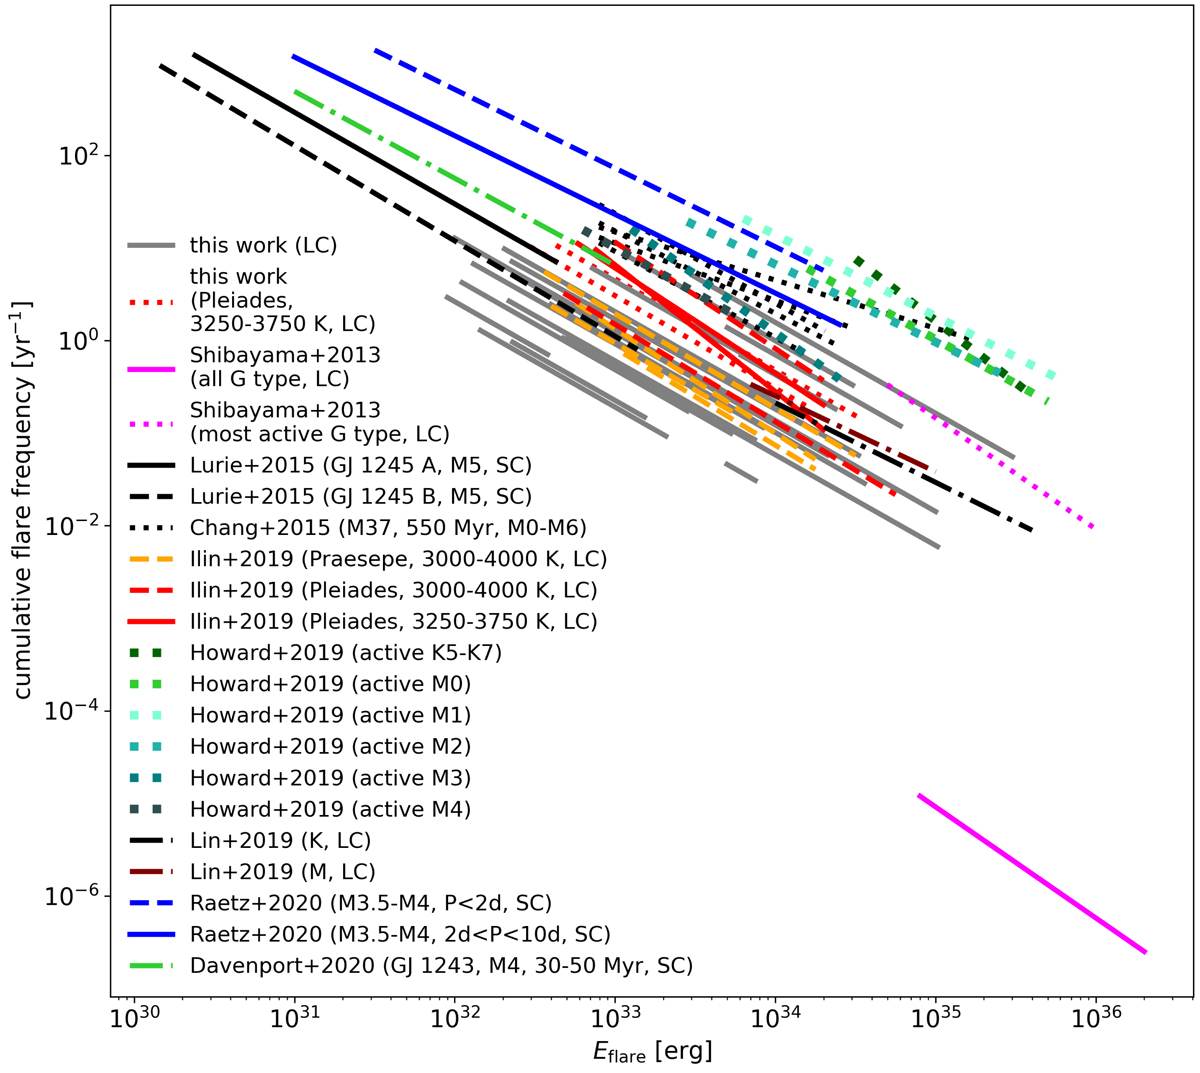
Comparison of FFDs found in different flare studies. Gray lines: FFDs from this work. The one-flare sample for 5000–6000 K in M 67 is indicated as the shortest visible gray line. Red solid lines, and red and orange dashes: K2 long cadence light curves study of the Pleiades and Praesepe in four Teff bins from 3000 to 4000 K each (Paper I). Magenta line and dots: Superflares on all G dwarfs in Kepler, and its most active subsample (Shibayama et al. 2013). Black line and dashes: Two M5 stars in an M5-M5-M8 triple system observed by Kepler (Lurie et al. 2015). Black dots: Flare study based on an MMT survey of the ∼550 Myr old open cluster M 37 (Chang et al. 2015). Dots in green and blue: Evryscope all-sky flare search on late K to mid M dwarfs (Howard et al. 2019). Black and brown dash-dotted lines: K2 long-cadence study of K and M dwarfs within 200 pc and 100 pc (Lin et al. 2019). Dark blue line and dashes: K2 short cadence light curves of M3.5-M4 dwarfs with known rotation periods below 2 d and between 2 and 10 d, respectively (Raetz et al. 2020). Green dash-dotted line: The 30−50 Myr old M4 flare star GJ 1243 exhibited a constant flaring activity for over a decade of intermittent space based observations with Kepler and TESS (Davenport et al. 2020). In the studies that are based on Kepler or K2 observations, “SC” and “LC” denote the use of 1 min and 30 min cadence time series, respectively.
Current usage metrics show cumulative count of Article Views (full-text article views including HTML views, PDF and ePub downloads, according to the available data) and Abstracts Views on Vision4Press platform.
Data correspond to usage on the plateform after 2015. The current usage metrics is available 48-96 hours after online publication and is updated daily on week days.
Initial download of the metrics may take a while.